I will add now a special collection of farming studies here as many of them are just candidates for the Ig nobel prize.
The most recent study introduces FaRMI, a “bacterial relative abundance farm home microbiota index”, probably introduced as the authors couldn’t find anything else. It reminds me very much to the polygenic risk score that rescues your study if you could not find the gene.
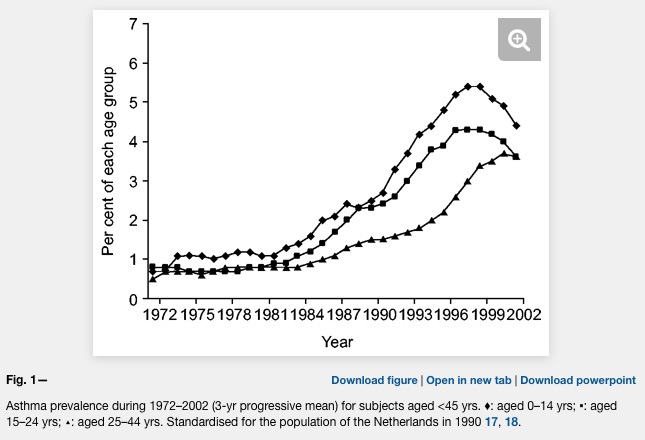
Asthma prevalence has increased in epidemic proportions with urbanization
Already the first sentence is wrong if we look at the following plot where asthma is clearly levelling off.
Unfortunately, the difference between farm and non farm children is never explained in the Kirjavainen et al. paper. What is the average distance of a non farm house to a farm house? Are there any joint school or sports activities of children from farms and non farms (allergens travel in the classroom)? And why is there such a strong conclusion in the title?
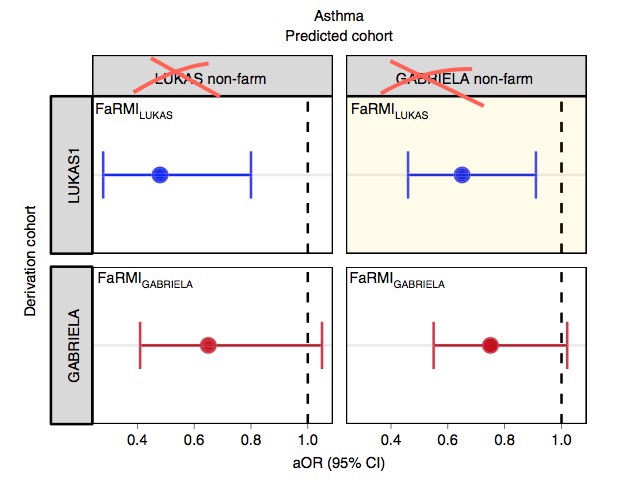
Farm-like indoor microbiota in non-farm homes protects children from asthma development
A lower risk score is not equivalent to protection.
And did any reviewer ever look at the plots or tables?
The FaRMI calculation is overly complicated. Probably the calculation can never be replicated by changing software, changing samples, unclear wording, suboptimal dimension reduction and data snooping.
Farm home microbiota-like community composition was modeled in LUKAS1 with logistic regression analysis (PROC LOGISTIC statement, SAS version 9.3). The home location on a farm or non-farm rural environment was the dependent variable and the main components of PCoA axis scores of β-diversity matrices were the predictor variables. Bacterial and fungal microbiota were investigated separately. For both bacteria and fungi, separate models were built using axis scores from PCoA of abundance-unweighted and -weighted β-diversity matrices. The PCoA axes were selected based on the scree plot method including axes above the point at which the variance explained by the additional axes levels off (Supplementary Fig. 3). The models give an estimate of the probability that the sample is from a farm home. The farm home likeness of the microbial composition in the LUKAS2 non-farm homes was then estimated by applying the regression coefficients obtained from the LUKAS1-based models to the corresponding microbial data from LUKAS2 samples.Some analyses were performed in non-farm homes of both LUKAS2 and LUKAS1 to obtain increased sample size and power if results remain comparable as was observed. Due to the discovered association with asthma, the probability that was modeled based on the relative abundance-weighted bacterial/archaeal β-diversity was named FaRMI and was studied further in greater detail.
And isn’t that just an association that may have a rather simple explanation?
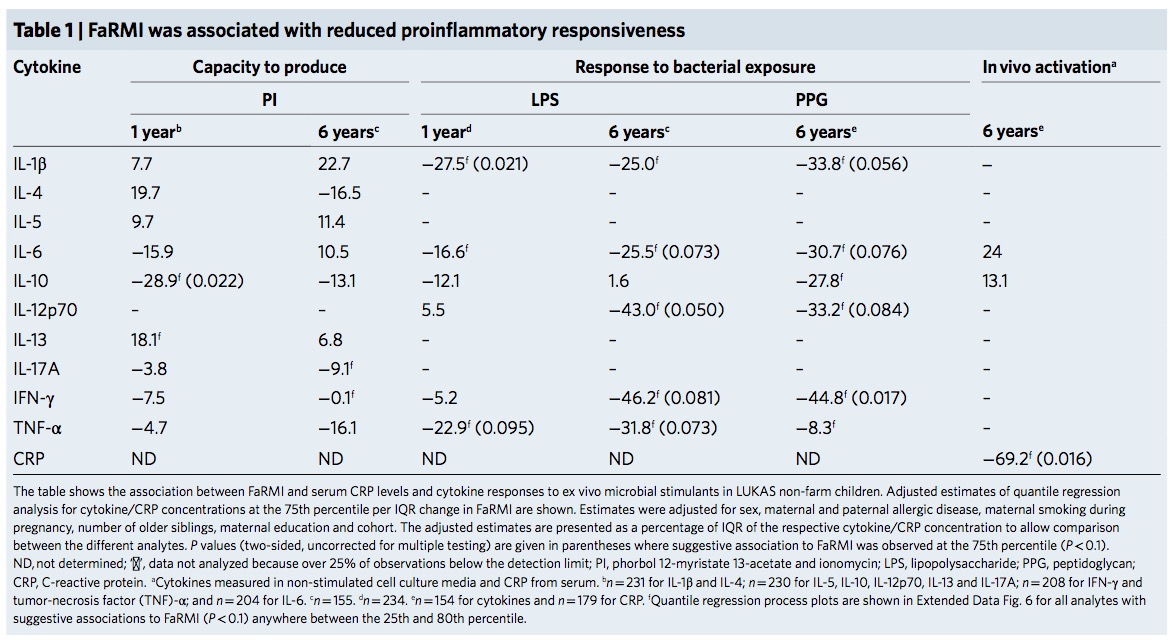
As FaRMI is weakly associated with muramic acid concentration in dust, the authors make Gram-positive bacteria responsible for the effect. The rhizosphere of soil is extremly rich of bacteria. The world’s first soil atlas showed hundreds of taxa but never differentiated between water resistant, gram positive and less water resistant gram-negative taxa. Maybe Gram positive Streptococcaceae are ubiquitous and depend on where you draw your samples?
FaRMI is found in non farm / rural children by bacterial/archaeal operational taxonomic units (OTUs) of soil origin which basically confirms my initial assumption: There was the same contamination of soil both in farm and non-farm homes if we look at supplement table 6 where walking indoors with outdoor shoes results in significant higher FaRMI values…Maybe the microbiome hype is already over.
Our results warrant translational studies to confirm the causal relationship through indoor microbial exposure-modifying intervention that may also form a novel strategy for primary asthma prevention.
Good luck with your future studies.
BTW – The scripts at Github are useless references to shell and Python scripts that will never run due to “—” characters. And what about that baby code?
outfolder=getwd()
eigenfile <- paste(outfolder, "/", prefix, "_PCoA_eigenvalues.txt", sep="")
writerow <- paste("Eigenvalue min / max: ", min.eigen, " / ", max.eigen, sep="")
write(writerow, file=eigenfile, append=F)
writerow <- paste("Sum of all eigenvalues: ", round(neg.eigensum, digits=6), sep="")
write(writerow, file=eigenfile, append=T)
writerow <- paste("Sum of all eigenvalues (negatives as 0): ", round(nonneg.eigensum, digits=6), sep="")
write(writerow, file=eigenfile, append=T)
writerow <- "Eigenvalues (pos & neg): "
write(writerow, file=eigenfile, append=T)
writerow <- paste(pcoa$value$Eigenvalues, collapse="\t")
write(writerow, file=eigenfile, append=T)
writerow <- "Percents (Negatives as negatives): "
write(writerow, file=eigenfile, append=T)
writerow <- paste(paste(neg.percent, " %", sep=""), collapse="\t")
write(writerow, file=eigenfile, append=T)
writerow <- "Percents (Negatives as 0): "
write(writerow, file=eigenfile, append=T)
writerow <- paste(paste(nonneg.percent, " %", sep=""), collapse="\t")
write(writerow, file=eigenfile, append=T)
Using R heredoc syntax I can rewrite 20 unreadable by 8 readable lines.
tmp <- 'Eigenvalue min / max: min.eigen / max.eigen
Sum of all eigenvalues: neg.eigensum
Sum of all eigenvalues (negatives as 0): nonneg.eigensum
Eigenvalues (pos & neg): pcoa
Percents (Negatives as negatives):  neg.percent %
Percents (Negatives as 0): nonneg.percent %'
for (i in c("min.eigen","max.eigen","neg.eigensum","nonneg.eigensum","pcoa$value$Eigenvalues","neg.percent","nonneg.percent") ) { tmp <- gsub(i,get(i),tmp) }
write(tmp, file=paste(getwd(),out,"/")
And why moving to SAS for a simple logistic regression? Is there anyone else in the academic world who pays $8,700 annually for a basic SAS Windows Analytics package just for that reason?