… which is the legend to a picture in Nature’s 13th Nov editorial accompanying their recent survey of 6,000 graduate students.
I’m concerned about the very competitive nature of early-career scientists. At some institutions people are very cut-throat rather than being supportive of colleagues.”
Only 44% are satisfied with the decision to pursue a PhD.
I wonder if these are the same 38% who expected an intellectual challenge (those students we are most interested in)?
The full dataset is online.
list.of.packages <- c("ggplot2", "openxlsx")
lapply(list.of.packages, require, character.only = TRUE)
tmp <- tempfile()
download.file("https://ndownloader.figshare.com/articles/10266299?private_link=74a5ea79d76ad66a8af8",tmp)
unzip(tmp,exdir="/Users/wjst/Desktop")
unlink(tmp)
phd <- read.xlsx("/Users/wjst/Desktop/Nature_PhD survey_Anon_v1.xlsx", sheet = "Cleaned data - anonymised", startRow = 1, colNames = TRUE, rowNames = FALSE, detectDates = TRUE, skipEmptyRows = TRUE, skipEmptyCols = FALSE, rows = c(1,3:6811), cols = NULL, check.names = FALSE)
# the word documentation has wrong variable names!
phd[phd$Q28=="No" & !is.na(phd$Q28),"Depressed"] <- c(0)
phd[phd$Q28=="Yes" & !is.na(phd$Q28),"Depressed"] <- c(1)
ggplot(data = phd) +
  geom_mosaic(aes(x = product(Q17, Q19.a) ), na.rm=TRUE, fill="blue")
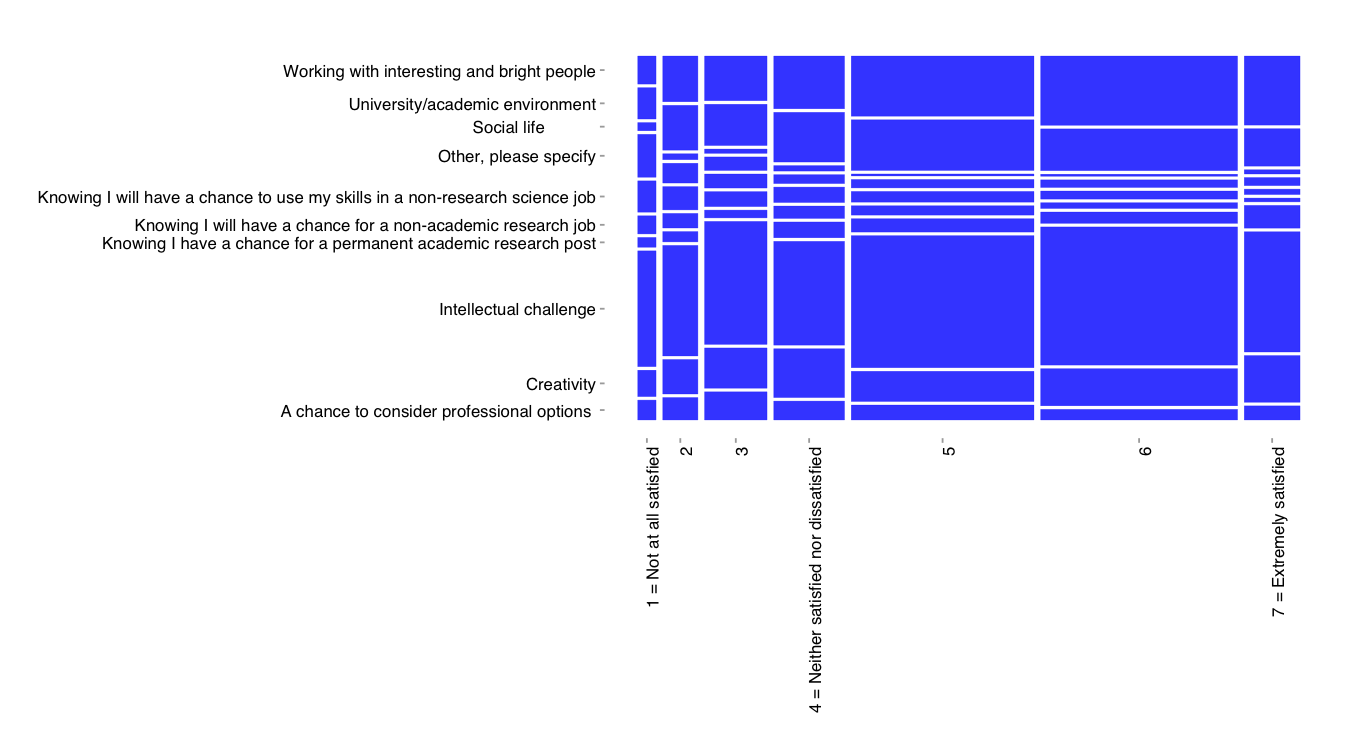
Good to see that “intellectual challenge” and “high satisfaction” occupies the largest area. But who is getting ill?
(TBC)