For teaching purposes I need the CO2 concentration vs earth temperature by year (Keeling curve). For that purpose we can use the Hadcrut 4 dataset created earlier while the global mean CO2 mix ratios (ppm) can be found at https://data.giss.nasa.gov/modelforce/ghgases/Fig1A.ext.txt.
After unscrambling that file and merging it to Hadcrut4 we can plot it
library(patchwork)
p1 <- ggplot(temp, aes(x=year, y=annual)) + geom_point() + stat_smooth(method="loess", span = .6) +
scale_y_continuous( name="difference from baseline [ oC ]", limits=c(-1,1) )
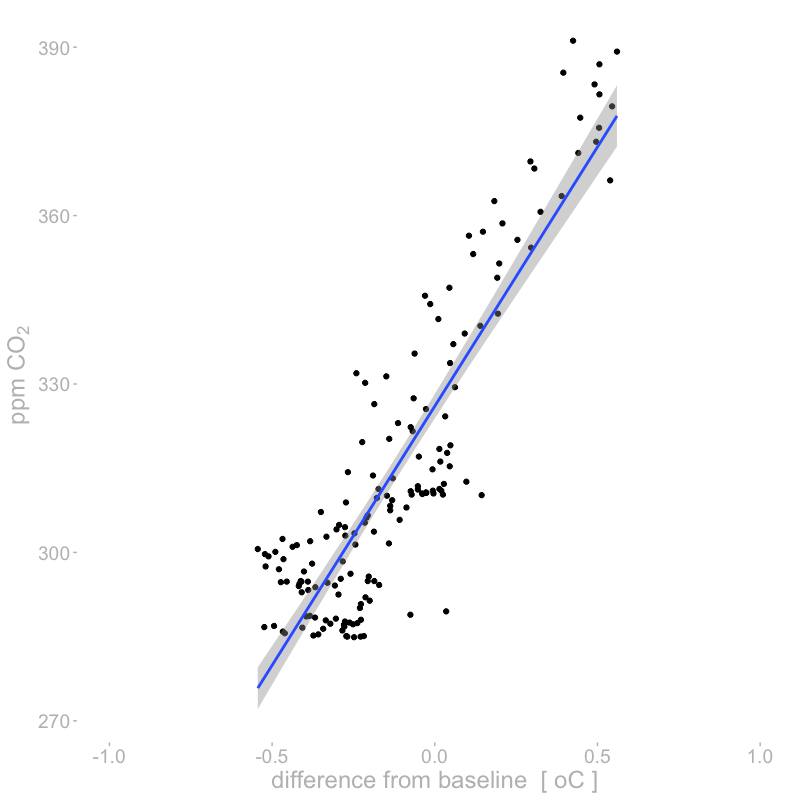
p2 <- ggplot(temp, aes(x=year, y=ppm )) + geom_point() + stat_smooth(method="loess", span = .6) +
scale_y_continuous( name=expression('ppm CO'[2]) )
p1+p2
Here are the two time courses

while the correlation is higher than I expected
References
- 1850-1957: D.M. Etheridge, L.P. Steele, R.L. Langenfelds, R.J. Francey, J.-M. Barnola and V.I. Morgan, 1996, J. Geophys. Res., 101, 4115-4128,”Natural and anthroupogenic changes in atmospheric CO2 over the last 1000 years from air in Antarctic ice and firn”.
- 1958-1974: Means of Scripps Institution of Oceanography Continuous Data at Mauna Loa and South Pole provided by KenMaarie (personal communication)
- 1975-1982: Means of NOAA/CMDL in-situ data at Mauna Loa and South Pole. (P. Tans and K.W. Thoning, ftp://ftp.cmdl.noaa.gov/ccg/co2/in-situ)
- 1983-2003: Global means constructed using about 70 CMDL CCGG Sampling Network station data. (P.P. Tans and T.J. Conway, ftp://ftp.cmdl.noaa.gov/ccg/co2/flask)
- 2004-2007: Global mean growth rates. (T. Conway, ftp://ftp.cmdl.noaa.gov/ccg/co2/trends)