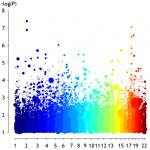
The experts in the field will immediately notice what I am suggesting here – an improved GWA plot that does not take into account p values alone but also effect sizes. I was experimenting some time with smile plots but finally ended with this bubble plot. Bubble size for 0.5<OR>2 is set to a minimum while all other ORs get increasing bubbles (BTW use for OR<1 a 1/OR transformation beforehand). Chromosomal colors are from a self defined palette using the colorRampPalette function in R which makes it look like pointillism art. The real question: Did the previous GWA p value screening miss some important effects? For example the important dot at x=4 and y=4?