Tag Archives: CO2

Die Korrelationsmanie

Materialsammlung bioinformatics / big data / deep learning / AI


Passend dazu auch der CCC Vortrag Nadja Geisler / Benjamin Hättasch am 28.12.2019

Deep Learning ist von einem Dead End zur ultimativen Lösung aller Machine Learning Probleme geworden. Die Sinnhaftigkeit und die Qualität der Lösung scheinen dabei jedoch immer mehr vom Buzzword Bingo verschluckt zu werden.
Ist es sinnvoll, weiterhin auf alle Probleme Deep Learning zu werfen? Wie gut ist sind diese Ansätze wirklich? Was könnte alles passieren, wenn wir so weiter machen? Und können diese Ansätze uns helfen, nachhaltiger zu leben? Oder befeuern sie die Erwärmung des Planetens nur weiter?


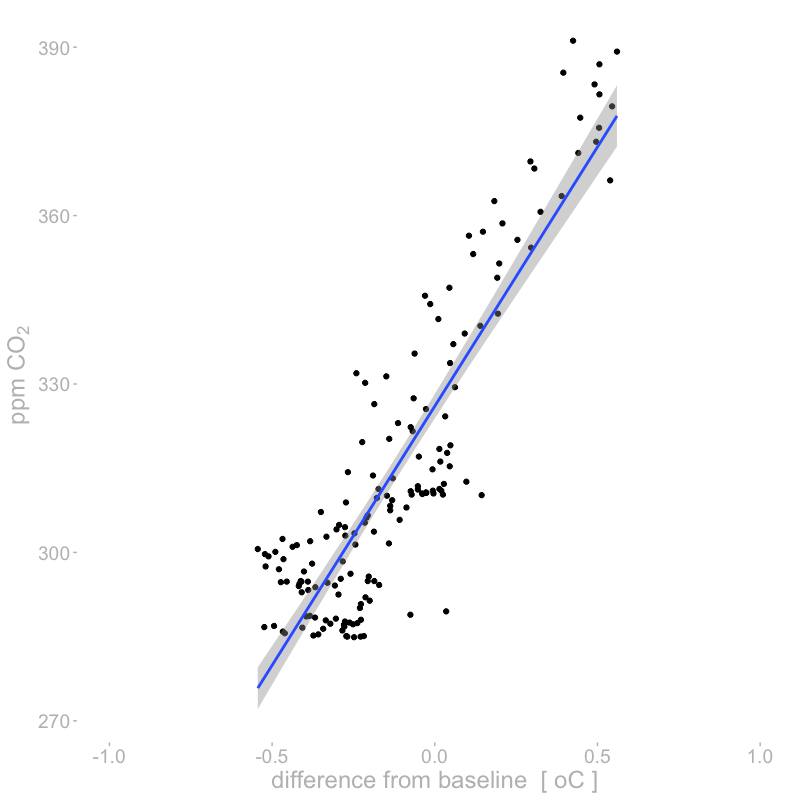
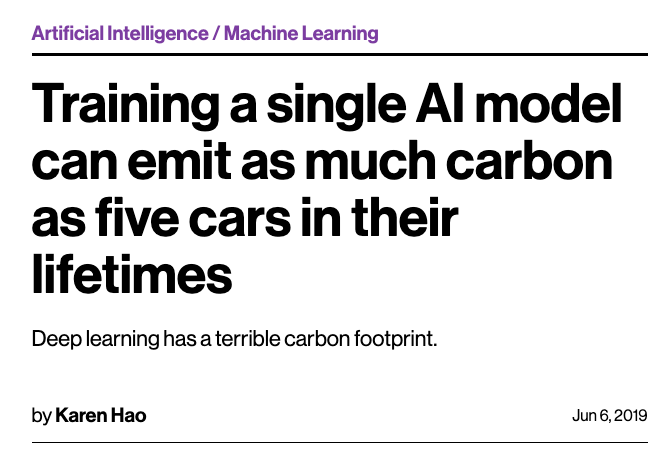
Dazu der gigantische Energieverbrauch durch die Rechenleistung.


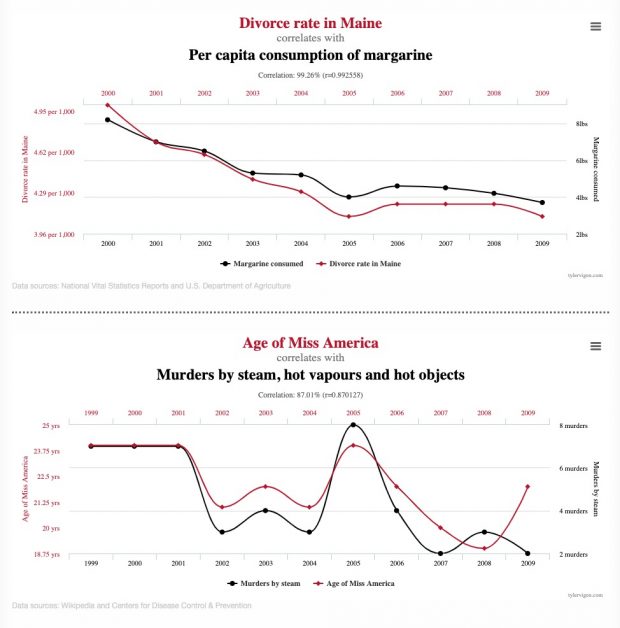
Wozu es führt: lauter sinnlose Korrelationen


https://www.technologyreview.com

Hundreds of AI tools have been built to catch covid. None of them helped.

Correlation of earth temperature and global mean CO2

For teaching purposes I need the CO2 concentration vs earth temperature by year (Keeling curve). For that purpose we can use the Hadcrut 4 dataset created earlier while the global mean CO2 mix ratios (ppm) can be found at https://data.giss.nasa.gov/modelforce/ghgases/Fig1A.ext.txt.
After unscrambling that file and merging it to Hadcrut4 we can plot it

library(patchwork)
p1 <- ggplot(temp, aes(x=year, y=annual)) + geom_point() + stat_smooth(method="loess", span = .6) +
  scale_y_continuous( name="difference from baseline  [ oC ]", limits=c(-1,1) )

p2 <- ggplot(temp, aes(x=year, y=ppm )) +  geom_point() + stat_smooth(method="loess", span = .6) +
  scale_y_continuous( name=expression('ppm CO'[2]) )
p1+p2

Here are the two time courses

Time course of earth temperature (1850-2018) and CO2 (1850-2011)

while the correlation is higher than I expected

Correlation of earth temperature and CO2


References

  • 1850-1957: D.M. Etheridge, L.P. Steele, R.L. Langenfelds, R.J. Francey, J.-M. Barnola and V.I. Morgan, 1996, J. Geophys. Res., 101, 4115-4128,”Natural and anthroupogenic changes in atmospheric CO2 over the last 1000 years from air in Antarctic ice and firn”.
  • 1958-1974: Means of Scripps Institution of Oceanography Continuous Data at Mauna Loa and South Pole provided by KenMaarie (personal communication)
  • 1975-1982: Means of NOAA/CMDL in-situ data at Mauna Loa and South Pole. (P. Tans and K.W. Thoning, ftp://ftp.cmdl.noaa.gov/ccg/co2/in-situ)
  • 1983-2003: Global means constructed using about 70 CMDL CCGG Sampling Network station data. (P.P. Tans and T.J. Conway, ftp://ftp.cmdl.noaa.gov/ccg/co2/flask)
  • 2004-2007: Global mean growth rates. (T. Conway, ftp://ftp.cmdl.noaa.gov/ccg/co2/trends)

Scientists who change their life style

There are scientists who support climate campaigns but there are also scientists who change their life style.

Kim Cobb traveled to the Kiritimati coral reefs in the spring of 2016 and found, to her horror, an underwater graveyard.
A climate scientist at the Georgia Institute of Technology, Cobb was alarmed to see this precious research site in the Pacific Ocean in such visible distress. The reefs were mostly dead after months of being in abnormally warm ocean waters […]
And so, she underwent a “wholesale reorganization” of her life, she said, including biking to work, rarely flying, going vegetarian, investing in expensive residential rooftop solar panels, and getting involved in her community’s new transportation plans.

Auf Deutsch – die drei besten Links zu dem Thema
“Klimahysterie!”, “Klimapropaganda!” (NZZ)
“Meine Generation hat vollständig versagt” (Lesch)
“Das Schüler-Klimaquiz der AfD” (Spektrum)