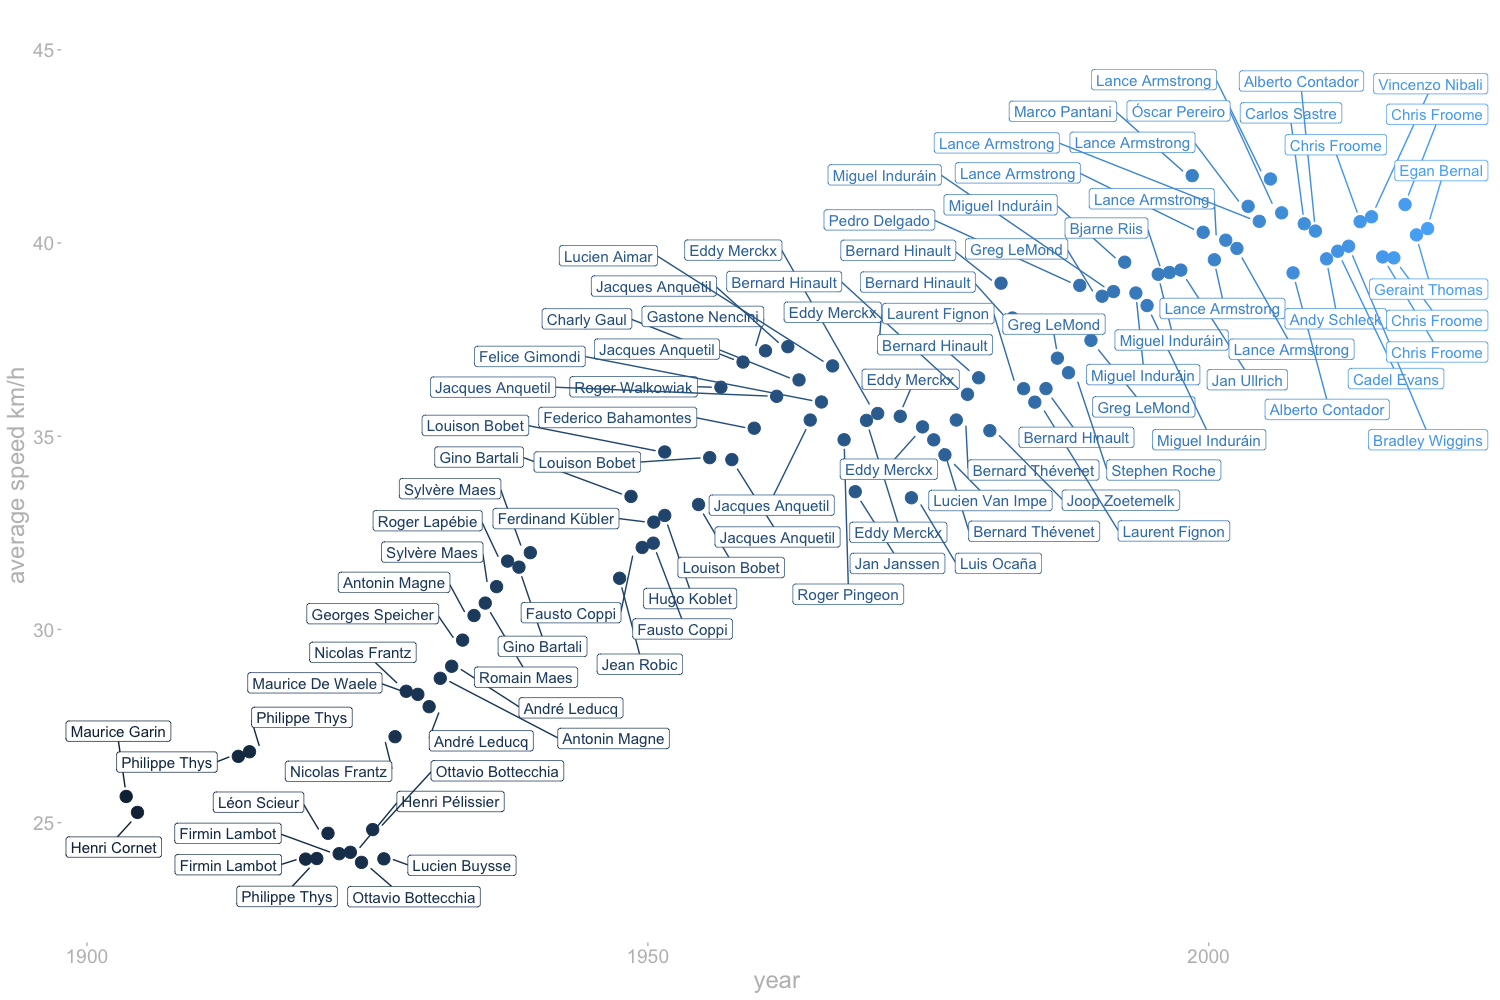
Using the new TdT R package, I have re done the speed plot
library(remotes)
install_github("alastairrushworth/tdf")
library(tdf)
editions %>%
  ggplot(aes(x = start_date, y = distance / time_overall, color = edition)) +
  geom_point(na.rm = TRUE,size=4) +
  geom_label_repel(data = editions, aes(label = winner_name), size = 4, na.rm = TRUE, segment.alpha = 1, point.padding=1) +
  xlab('year') +
  ylab('average speed km/h') +
  ylim(23,45)
CC-BY-NC Science Surf , accessed 13.07.2026