Here are some instructions how to create genome coordinate plots with Sigmaplot. The Systat Sigmaplot FAQ recommends for this kind of figures “floating bars” that
can be created using two different mechanisms. If you just need a simple floating bar chart, you can use a box plot of two values per column. Enter the top and bottom ranges for your bars in each column, and then create a box plot…
If you need to create grouped, floating bar charts, you will need … a masking plot. Create a grouped bar chart, using the upper values of the bars. Create a second bar chart for the same graph (click the graph, then click the grouped bar chart icon from the Graph toolbar), this time, using the lower values of the bars.
None of these methods works with fill patterns. Also repeated segments (at the same level) are not possible.
So I have worked out therefore another method using a stacked bar plot:
(1) put in the first column an increasing value 1 … 10 (->gets Y axis)
(2) put into the second column zeros (->gets start set 1)
(3) third colum: first feature start (->gets end set 1)
(4) fourth column: zeros (->gets start set 2)
(5) fifth column: first feature end (->gets end set 2)
(6) and so on
(7) assign colors: white for start set 1, blue for start set 2, white for start set 3 and so on
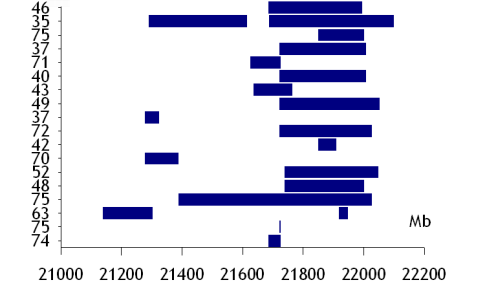
You should then end up with a plot like this