Rompa et al. claim that
Asthma and atopy were inversely associated with presence of a farm within a radius of maximum 100m.
wich refers to their FIG 3
Original legend: Number of farms within a given radius was dichotomized for at least one farm in the radius versus no farms. Associations are calculated by logistic regression resulting in odds ratios (OR) with 95%- confidence intervals.
The authors probably want to say that a non farm child that lives within a smaller distance to a farm shows a stronger negative association. Unfortunately it is not clear from the methods how the categories have been exactly defined, including or excluding category borders? And why is the highest category of 1.000-10.000 excluded here? There is a negative association with asthma in ALL strata irrespective of distance – what is the reference? The increased atopy risk by a farm in a circle with 1.000m radius is never discussed. BTW I am also quite sure that this plot has been produced with some kind of drawing software and not with “R version 3.2.3” if you zoom into the picture.
For whatever reason the authors abandon the distance definition above in favor of some data-derived classification afterwards. Why?
[1] children living on a farm currently run by the family [2] children not living on a farm, but with regular contact to farms, meaning at least once a week for a period of 6 months minimum and [3] children without any contact to farms.
I have no idea what regular contact is. But lets have a look on FIG 2
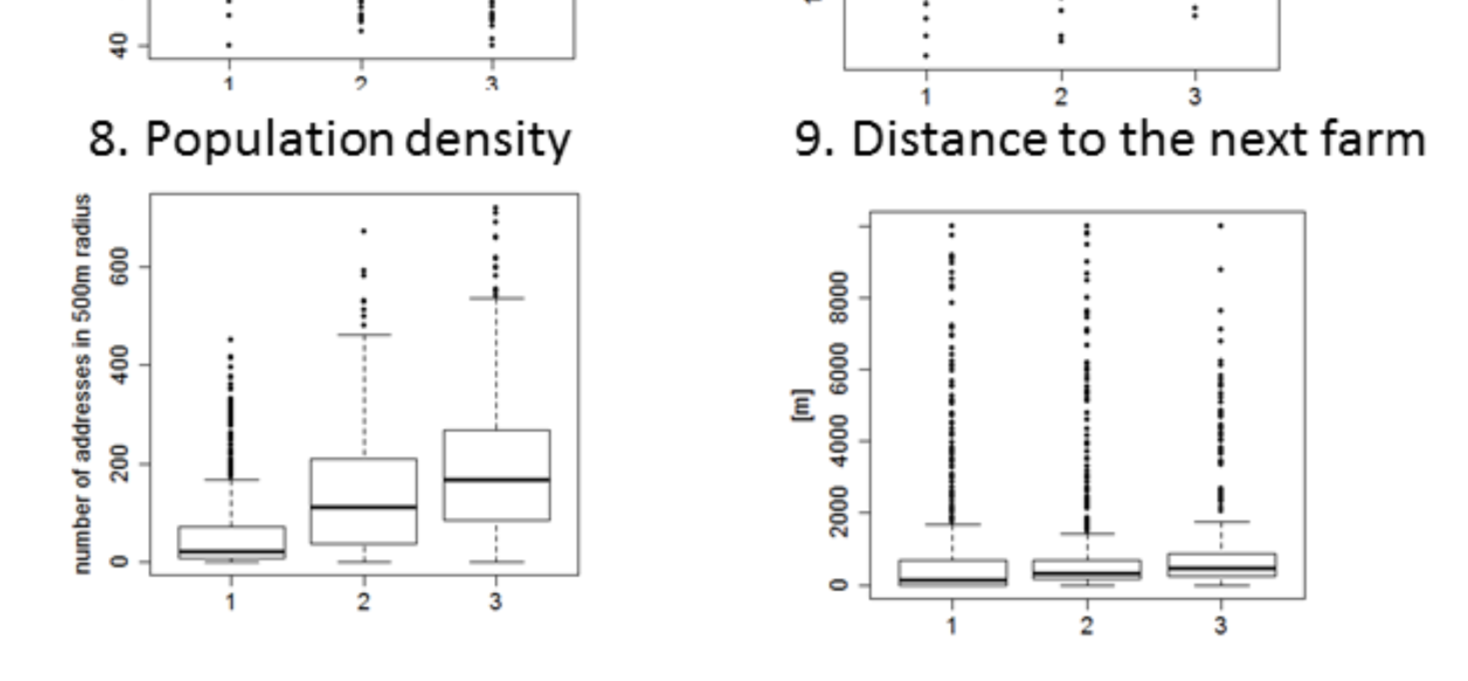
Original legend: Distribution of environmental variables across exposure strata 1 = farm children, 2 = exposed non-farm children, 3 = non exposed non-farm children. Differences between the subgroups were statistically significant (p<0.01) except for ozone, altitude and distance to the next farm.
This is also not a facet_warp() as I would expect from a R analysis but some manually cut & pasted figures where P<0.01 is contradicting the methods. FIG 2.9 basically says that the distance to the next farm is not different in groups of “farm exposure”.
The abstract
The environmental variables greenness, tree cover, soil sealing, altitude, air pollution differed not only between farm and non-farm children, but also between farm children with and without another farm nearby.
is therefore wrong (it maybe even trivial as farms of course have less soil sealing than villages). In any case, we are now trapped in a loop as according to Fig 1 the prevalence of asthma and atopy over the exposure strata should have been different.