CC-BY-NC Science Surf , accessed 25.07.2026
Nachdem ich viele Jahre damit verbracht habe die Hygiene Hypothese der Allergien zu widerlegen, dass
die "Auseinandersetzung" des kindlichen Organismus mit Schmutz und Keimen [ist ]eine wichtige Voraussetzung für eine normale Entwicklung des Immunsystems ist … Gründliche oder sogar übertriebene Hygiene führt nach dieser Theorie dazu, dass das Immunsystem nur eingeschränkt aktiviert wird. Es ist dadurch "unterbeschäftigt" und tobt sich quasi mit der Ausbildung allergischer Erkrankungen aus.
bin ich dem prominenten Beistand nun doch sehr dankbar für seine Aussage

Bonuslinks
Merchandising (fun)
*** Artikel (englisch)
*** Blog (deutsch)
19.12.2023 Update
Warum hinter “Immunschuld” ein Missverständnis steckt
Nachholeffekte Grund für viele Ansteckungen
Retraction Watch says on Jan 30, 2020 that
Until yesterday the New England Journal of Medicine had retracted only 24 papers. Now that tally is 25.
While the retracted paper has been cited 190 times, here are inaccuracies in another NEJM paper that has been cited 1961 times.
Full details are at PubPeer.
Is it justified to speak of a “protective” effect just by a negative association?
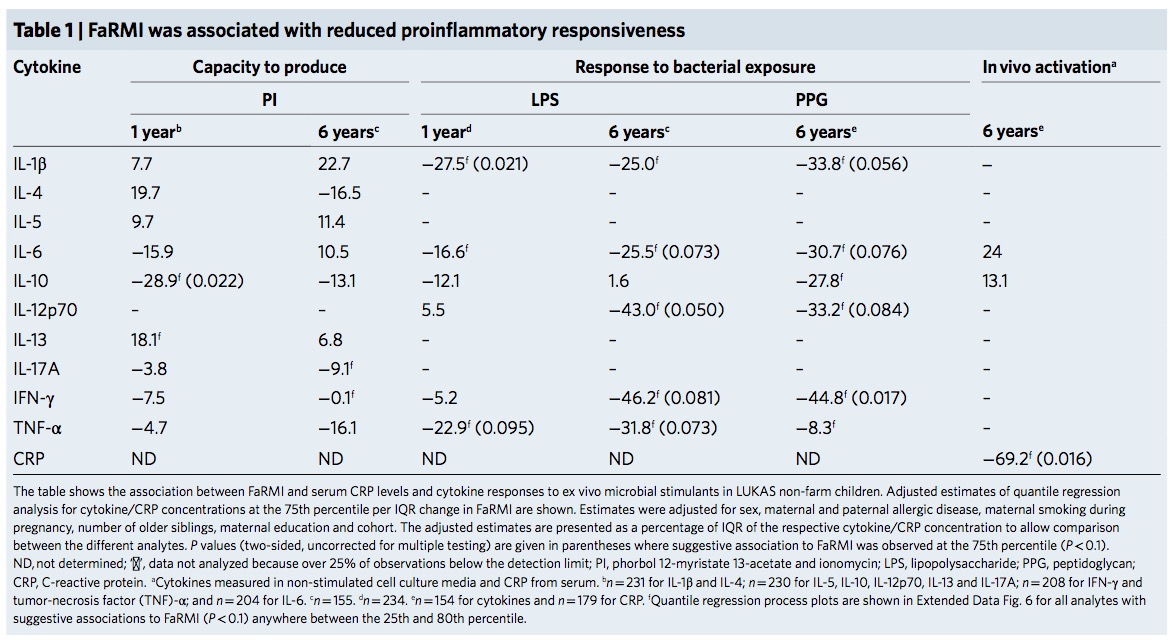
In addition to the problems with the math, I don’t get the point – farming should be leading to a generally reduced capacity for numerous pleiotropic cytokines?
There are even reports that LPS induces TH2 dependent senstization which is exactly the opposite of what this paper wants us to believe by some cryptic smoother applied to a heterogenous population.
Rompa et al. claim that
Asthma and atopy were inversely associated with presence of a farm within a radius of maximum 100m.
wich refers to their FIG 3
The authors probably want to say that a non farm child that lives within a smaller distance to a farm shows a stronger negative association. Unfortunately it is not clear from the methods how the categories have been exactly defined, including or excluding category borders? And why is the highest category of 1.000-10.000 excluded here? There is a negative association with asthma in ALL strata irrespective of distance – what is the reference? The increased atopy risk by a farm in a circle with 1.000m radius is never discussed. BTW I am also quite sure that this plot has been produced with some kind of drawing software and not with “R version 3.2.3” if you zoom into the picture.
For whatever reason the authors abandon the distance definition above in favor of some data-derived classification afterwards. Why?
[1] children living on a farm currently run by the family [2] children not living on a farm, but with regular contact to farms, meaning at least once a week for a period of 6 months minimum and [3] children without any contact to farms.
I have no idea what regular contact is. But lets have a look on FIG 2
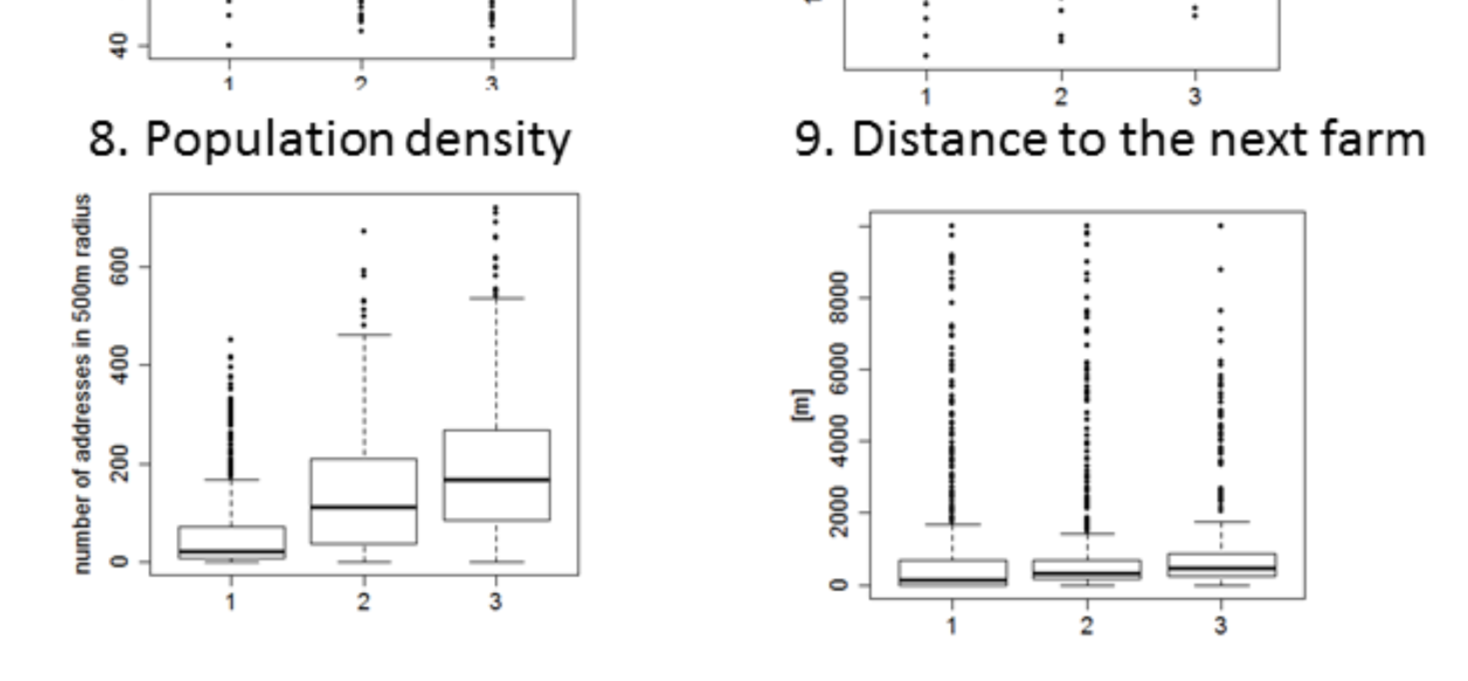
This is also not a facet_warp() as I would expect from a R analysis but some manually cut & pasted figures where P<0.01 is contradicting the methods. FIG 2.9 basically says that the distance to the next farm is not different in groups of “farm exposure”.
The abstract
The environmental variables greenness, tree cover, soil sealing, altitude, air pollution differed not only between farm and non-farm children, but also between farm children with and without another farm nearby.
is therefore wrong (it maybe even trivial as farms of course have less soil sealing than villages). In any case, we are now trapped in a loop as according to Fig 1 the prevalence of asthma and atopy over the exposure strata should have been different.
Keine Frage, die Lebensbedingungen auf Bauernhöfen sind anders. Mehr Tiere, mehr Dreck, mehr frische Luft, vieles ist anders als in der Großstadt. Dass es hier auch weniger Allergien gibt, wird wohl an den Bedingungen liegen, die bereits an einer der ersten Studien vor 30 Jahren zu sehen waren.
Auch die Eltern hatten schon weniger Allergien. Der “protektive” Effekt kann also einfach dadurch erklärt werden, dass mit weniger Eltern als “Risikofaktor” auch weniger Kinder Allergien haben. Und warum die Eltern wohl weniger Allergien haben? Nun ja, mit Heuschnupfen wird man nicht gern im Heu arbeiten wollen. Auch das zeigen Studien ziemlich eindeutig.
Wenn man genau hinschaut, dann haben alle Bauernhofstudien immer wieder dieselbe Argumentationsstruktur: weil die Bedingung X dort so ist, dann kann die Folge Y auch auf die Bedingung X zurückgeführt werden. Allerdings machen immer mehr Beschreibungen von X die Story nicht glaubwürdiger. Keine der jemals beschriebenen Bedingungen X, ist aus der Bauernhofsituation auf eine allgemeine Situation übertragbar gewesen, von einem einzigen verunglückten Versuch abgesehen.
Hier die Story mal erläutert an einem simulierten Datensatz – eine normal verteilte Allergiehäufigkeit und normal verteilte Endotoxinwerten. Zwischen beiden Variablen gibt es keine Korrelation.
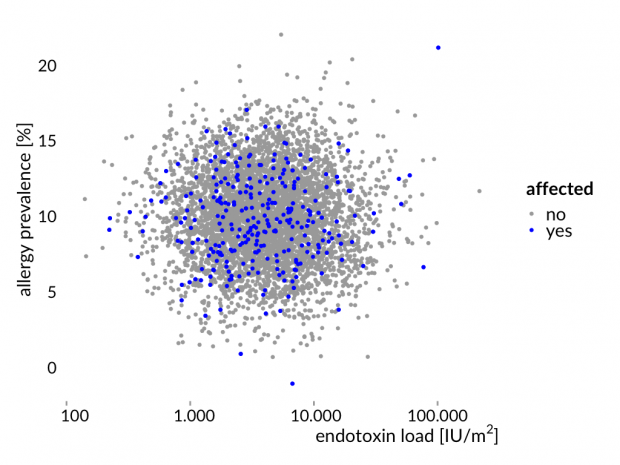

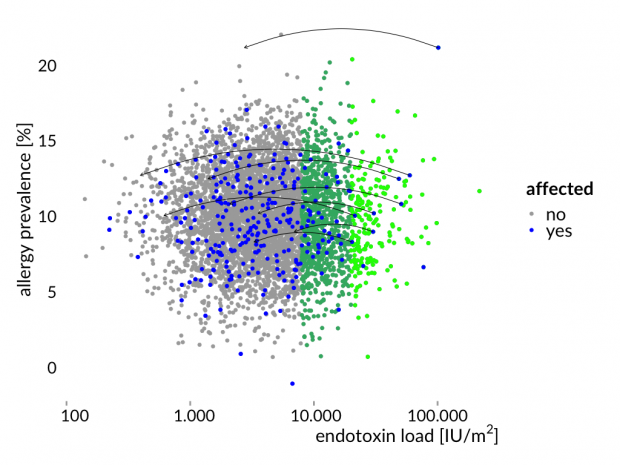

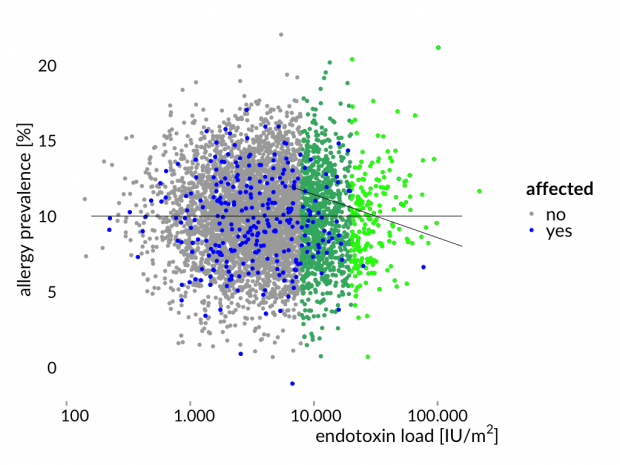
Das ist nun genau das Ergebnis der Bauernhofstudien.
Natürlich kann ein hoher Endotoxin Spiegel auf den Bauernhöfen eine bestimmte Wirkung haben – zumindest bei einigen Menschen und bei einigen Mäusen – aber mehr ist nach aktuellem Kenntnisstand auch sehr unwahrscheinlich.
Da die Lebensbedingungen auf dem Bauernhof angeblich protektiv sind, müsste es eigentlich Kinder geben, die eine Allergie haben sollten (zB wenn beide Eltern allergisch sind) aber nun doch keine Allergien bekommen haben. Solche Kinder gibt es aber nicht…
Und hier auch noch das ganze auf Englisch im Blog oder in einem wissenschaftlichen Artikel – Epidemiologen kennen den Effekt als klassischen Collider Bias.
This blog post has been now replaced by a full paper, online at https://www.medrxiv.org/content/10.1101/19007864v1
The live presentation was here

Some further mechanistic considerations are at https://www.wjst.de/blog/sciencesurf/2019/04/il33-allergy-and-helminths/
N Engl J Med 2011;364:701-9 is another paper with 1000+ citations that had a lasting impression on some but not all people.
First, I can’t remember of any study with such an enormous selection bias where >94% of individuals have been lost.
Second, we should not forget that farm is not protective per se – farmers may just avoid a known allergy risk factor. PARSIFAL participants in this study included Steiner schools — anthroposophic medicine mostly avoids vitamin D (ref). This is of course a major issue for any cross-sectional study that doesn’t take into account the temporality of events.
Third, in PARSIFAL dust from children’s mattresses were collected by vacuuming — it is not very likely that many helminthic eggs were transported from stable to bedroom. In GABRIELA, only airborne dust samples were collected which again may miss helminth eggs although being certainly present in stable dust.
Fourth, more microbial exposure and more fungal taxa on farms are a trivial finding.
The inverse associations of the diversity scores with asthma were not confounded by status with respect to living on a farm because adjustment did not change the respective point estimates for asthma (Table 2), although the associations became nonsignificant.
Small sample size, borderline p-values even after a long fishing expedition?
What do these strange “probability” plots really show – the probability of asthma or the probability to live on a farm?
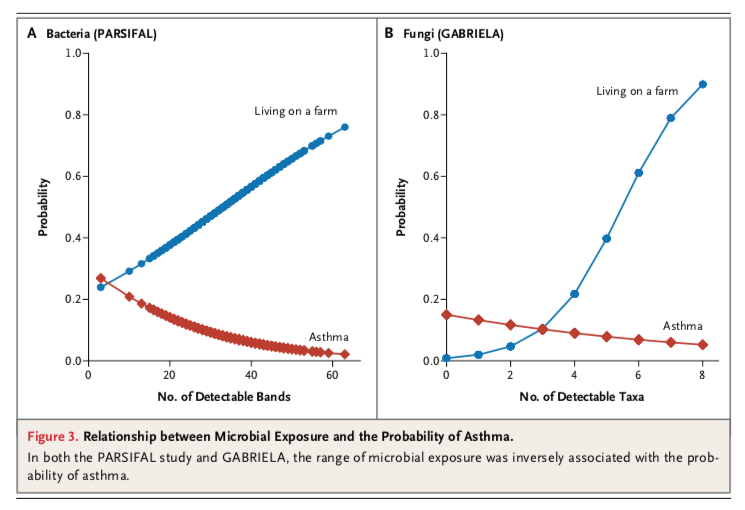
The plots are misleading if adjustment for farm living does not change the parameter estimates for bacterial/fungal diversity.
Sixth – even many years later, the main findings of this study have not been independently replicated. There is not any single study that shows listeriosis (Listeria) or diphtheria (Corynebacterium) to be protective.
There are many immunological differences in humans and mice (follow my link) that are never discussed — not even in Science 2015;349/6252:1106.
Ignoring the long-standing paradox that endotoxin is also acting as a natural adjuvant to atopic inflammation, the credibility of the Science paper is further reduced.
IMHO it is also a strange experimental condition to have all animals on a standard vitamin D diet – a known co-sensitizers – and looking then for A20 which is co-regulated by vitamin D ??
And here is the last argument – more than 90% of studies in mice fail to translate into humans.
The recent encyclopedia article about the hygiene hypothesis seems to be well written. At least on the first instance … in reality it is more a novel than a scientific review.
For many years already, the hygiene hypothesis has been called an outdated concept; various times it was revised and transformed, and finally it gave birth to novel hypotheses.
In other words, the hypothesis has been rejected for being wrong . Even many revisions did not change that. There seem to be only one proven fact – the obsession of some authors with hygiene and nouvel Rousseauism.
Anyway, the hygiene hypothesis has promoted radical rethinking of infections, microbiota, and coevolution of mankind and microbes.
There is nothing radical in backward thinking. We still carry tons of microbes, freezer and antibiotics only did some qualitative but not so much quantitative changes,
With the advent of novel high-throughput sequencing technologies the human microbiome, which is sometimes called the 'forgotten organ,' has attracted much attention and is currently being implemented in a wider concept of self-foreign relationship, which may even include recognition of the nonmicrobial nonself as a vital stimulus to a well-developing immune system.
Given the many molecule classes regulating immune functions across individuals such as short RNAs, the hygiene hypothesis may eventually come back as a surprising explanation of the phenomena evoked by crowding, day care, sibship size, orofecally transmitted diseases, and respiratory infections.
Why that?
A comeback of the hygiene hypothesis by short RNA?
The listed phenomena are not intrinsically related, but are occuring only at the same time scale.
Even the old birth order effect might be rediscovered as epigenetic programming someday. Admittedly, these notions are entirely hypothetical, but without hypotheses, proven or not, science hardly advances.
So if David Strachan’s birth order effect would be really caused by epigenetic programming – why would that be related to hygiene at all?
Science is is not so much about proven or unproven but about reasonable and non reasonable hypotheses.
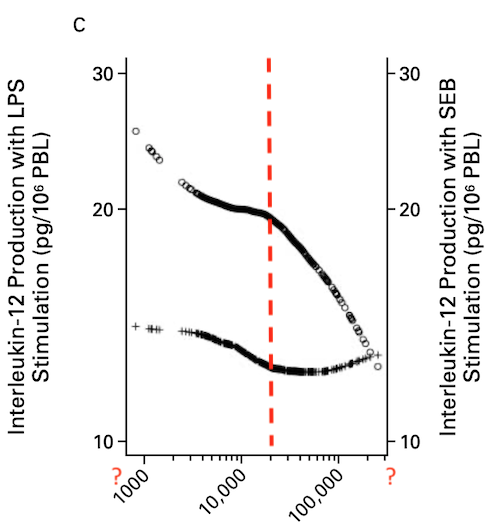
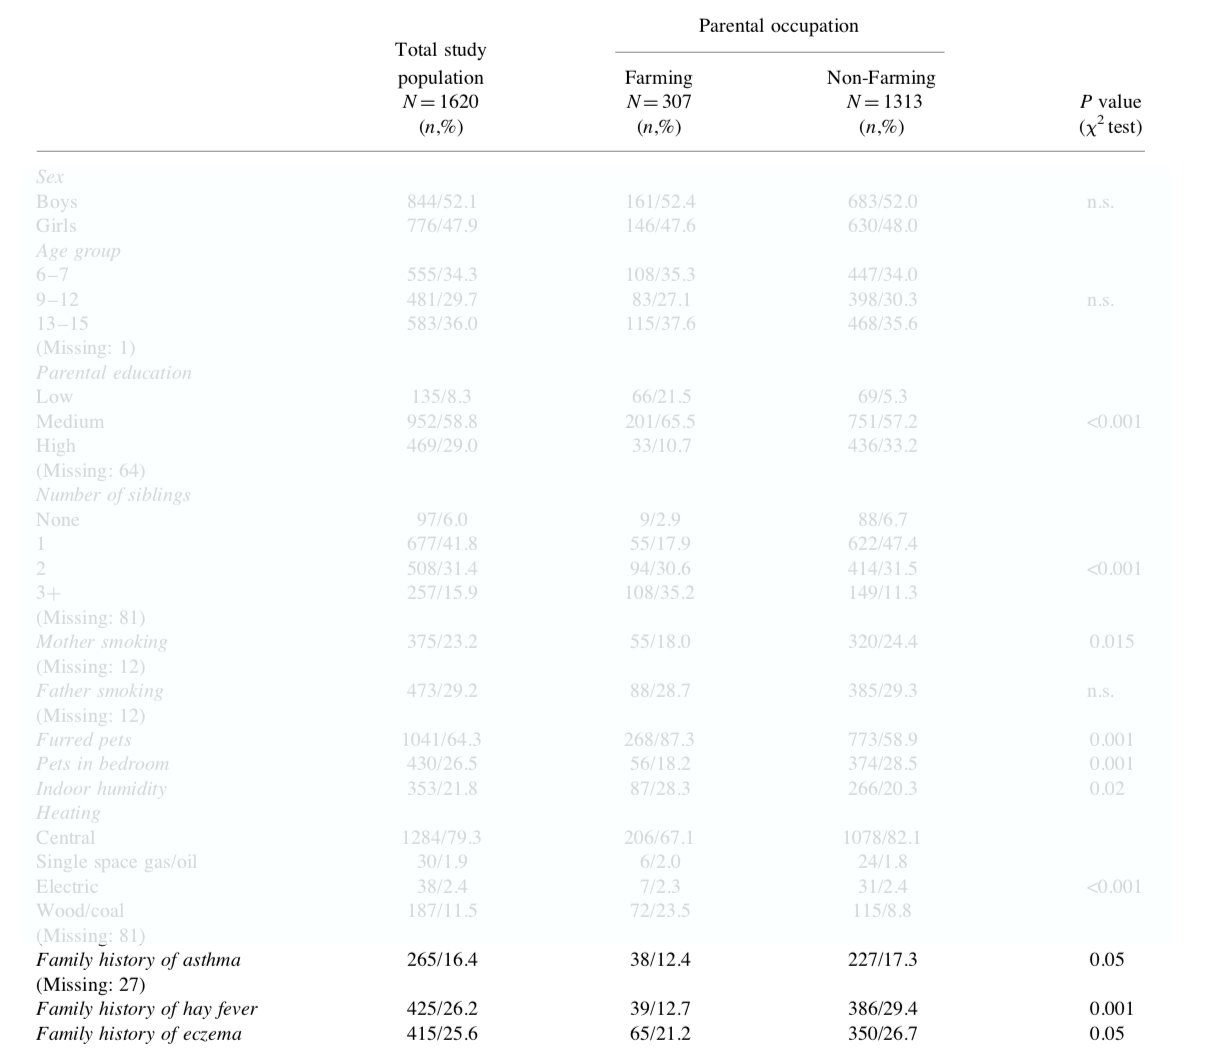
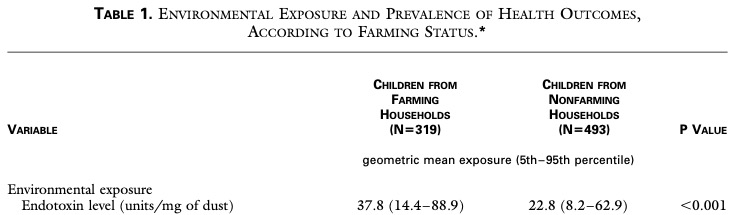
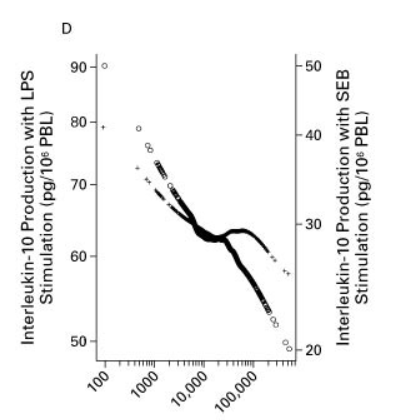
N Engl J Med 2002; 347:869-877 made a strong point that the farm effect is mediated by endotoxin but could show only a 1,7 fold higher endotoxin exposure at farms.
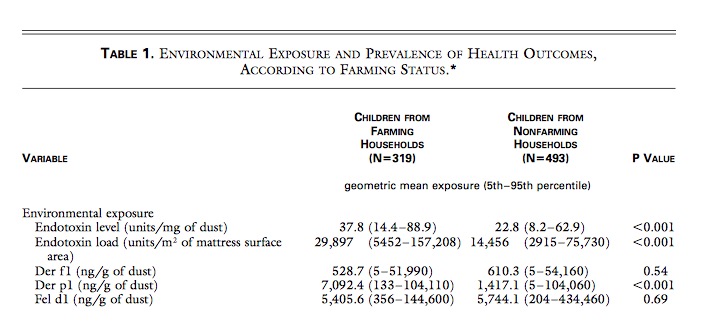
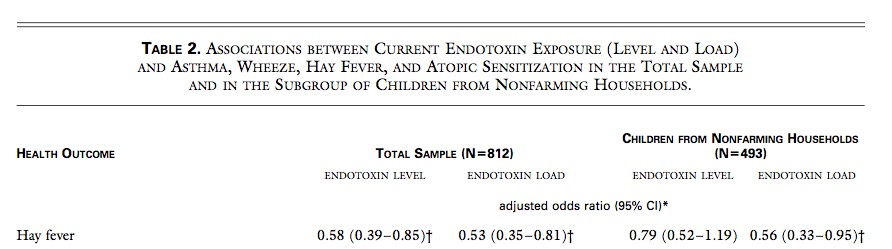
LPS therefore will not explain the negative farm association as endotoxin effects are so much similar between farming and non-farming environment. BTW why is only the result of the total sample given here and not just the farm result?
So, what is the reason for the lower IL10 capacity in Figure 2D after LPS exposure – exhaustion, adaptation? And even more important: What is the reason for the lower allergy rate at farms?
If we now go back to table 1 there is a 5,0 fold Der p1 excess in farm – much higher than the 1,7 fold increase of endotoxin. As nearly all allergens have helminth homologues – the question is what did the authors really measure? Da Costa Santiago 2015 has a nice table that could give an answer.
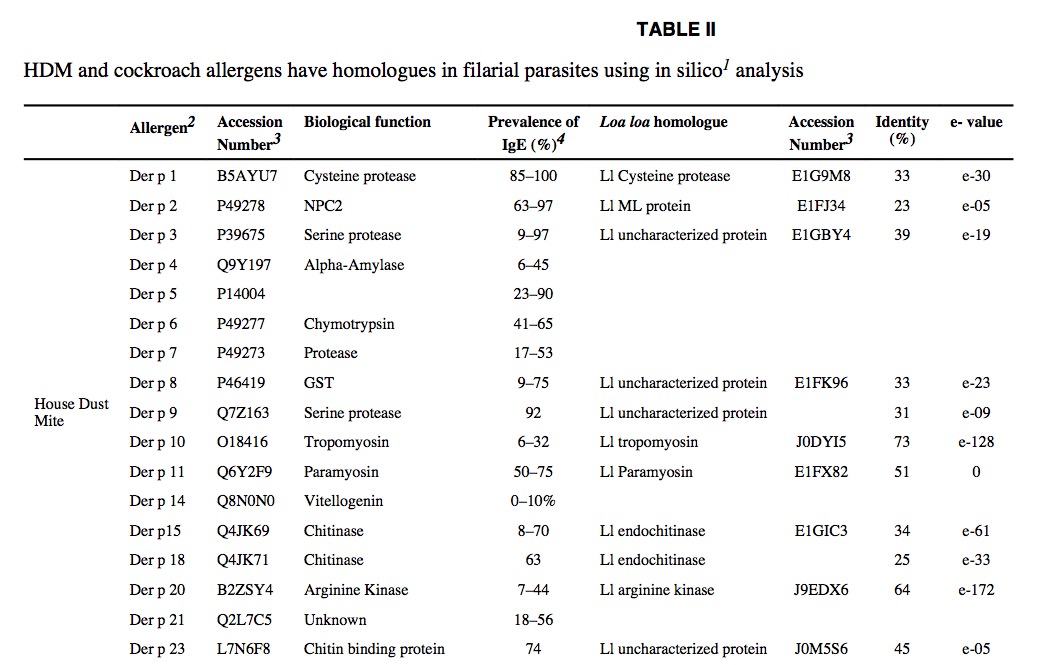
Der p1 is a cysteine protease of 25kDa that has homologues for example in Loa loa. Unfortuneately Loa loa is not an explanation at Bavarian farms – as it is more common in tropical Africa. Cysteine proteases are nevertheless a big tool for helminths – in Schistosoma japonicum a cathepsin B2 cysteine protease is considered the main penetration tool.
Usually cysteine proteases are not allergenic, but the excessive (and rather isolated) rise combined with a reduced Der p1 sensitization in the children, is definitely an unusual finding. The Dermatophagoides pteronyssinus habitat is cosmopolitan, house dust, also influenced by altitude, but there is no known reasons for this excess in farms. Is the Der p1 value just a false positive and has it helminthic and not mite origin?
I am therefore blasting Der p1 sequence (P08176) against all known cow endoparasite genomes. Fasciola has a strong hit with CL6, a papain family cysteine protease with e+48.
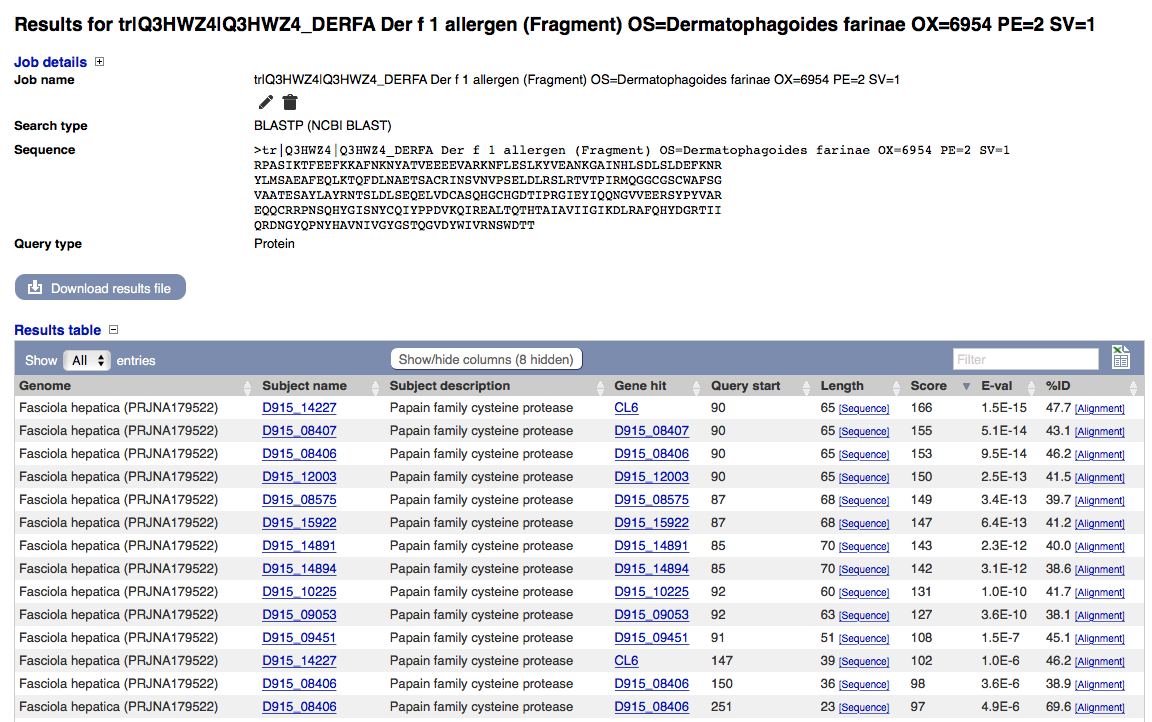
With identity values between 40% and 70% there could well be a confusion of mite Der p1 and helminth (Fasciola?) CL6, which should be tested for cross-reactivity.
The story even gets more interesting when reading more about parasites
Helminth parasites have complicated life cycles … at the same time as skewing the immune system toward a Th2-driven response, they have a general suppressive effect on the host immune system that prevents their elimination and reduces immune-mediated tissue damage. It has been suggested that cytokines of the anti-inflammatory network, particularly IL-10 and transforming growth factor- (TGF-), that are produced in response to continual stimulation of the immune system by parasite antigens, are pivotal to regulating the damage they cause and that, coincidentally, these have a bystander protective affect against allergic reactions.
This is exactly what N Engl J Med 2002; 347:869-877 showed: increasingly exhausted IL10 capacity. May the x-axis label should be CL6 instead of LPS?
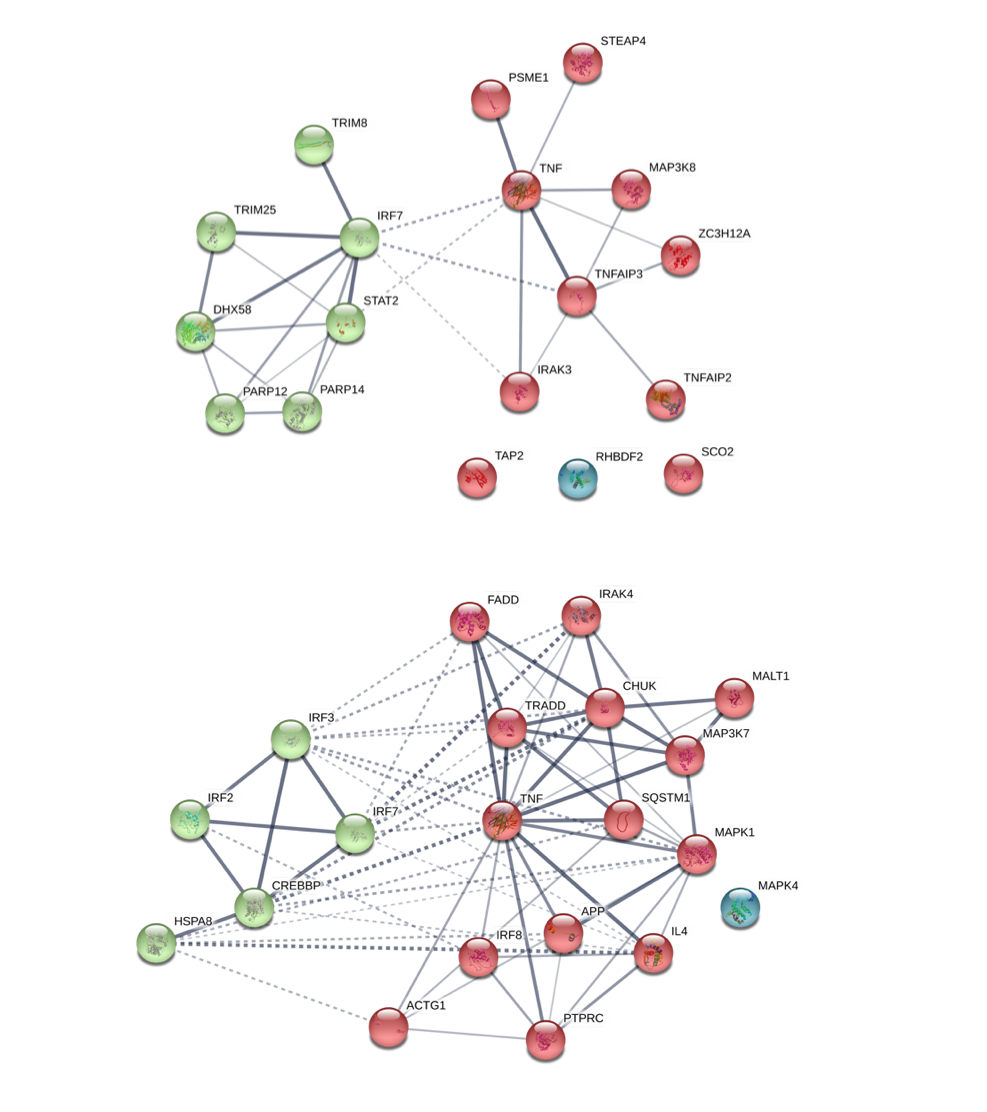
A recent study in the NEJM found remarkable differences in the asthma prevalence between Amish and Hutterite populations. The lifestyle of both communities is similar but their farming practice is distinct as the Amish follow a more traditional style of outdoor grazing whereas the Hutterities use industrialized farming practices. Gene expression data in the Amish children have been interpreted as "intense exposure to microbes" because protection of experimental asthma by Amish derived house dust was nearly abrogated in mice deficient for MyD88.
Any helminth exposure has been excluded due to low IgE and eosinophil counts in the children while I still think that this could be an explanation in particular as the attempt to show an effect of bacterial exposure was unsuccessful since the discovery of the farming effect.
One difference between conventional stable (Hutterites) and outdoor grazing (Amish) is the higher helminthic infection rate on pasture, mainly with Fasciola, Ostertagia, Eimeria, Cooperia, Dictyocaulus and Trichostrongylos species.
Infected cattle rarely demonstrate clinical disease, while it is known that Fasciola (as for example Schistosome) has numerous immunosuppressive functions in the host. IgE is not always raised as Fasciola can degrade human immunoglobulin or even induce eosinophil apoptosis.
I will add now a special collection of farming studies here as many of them are just candidates for the Ig nobel prize.
The most recent study introduces FaRMI, a “bacterial relative abundance farm home microbiota index”, probably introduced as the authors couldn’t find anything else. It reminds me very much to the polygenic risk score that rescues your study if you could not find the gene.
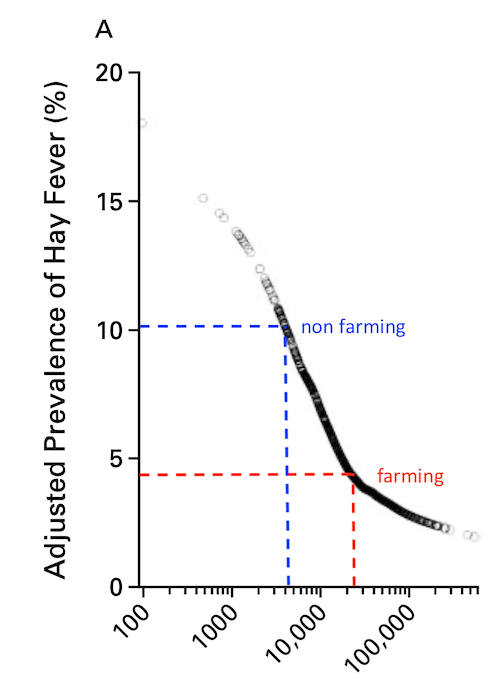
Asthma prevalence has increased in epidemic proportions with urbanization
Already the first sentence is wrong if we look at the following plot where asthma is clearly levelling off.
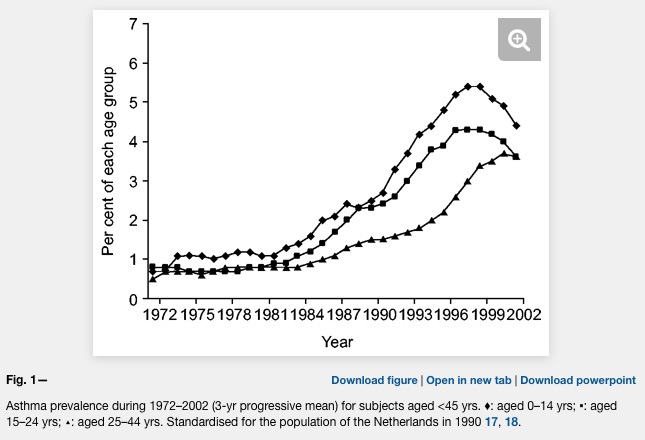
Unfortunately, the difference between farm and non farm children is never explained in the Kirjavainen et al. paper. What is the average distance of a non farm house to a farm house? Are there any joint school or sports activities of children from farms and non farms (allergens travel in the classroom)? And why is there such a strong conclusion in the title?
Farm-like indoor microbiota in non-farm homes protects children from asthma development
A lower risk score is not equivalent to protection.
And did any reviewer ever look at the plots or tables?
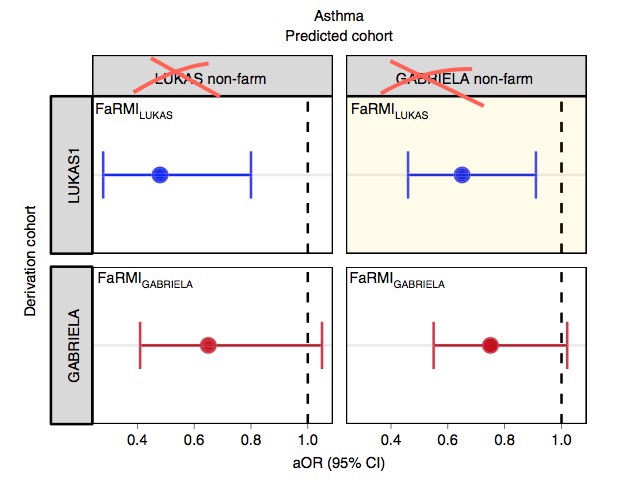
The FaRMI calculation is overly complicated. Probably the calculation can never be replicated by changing software, changing samples, unclear wording, suboptimal dimension reduction and data snooping.
Farm home microbiota-like community composition was modeled in LUKAS1 with logistic regression analysis (PROC LOGISTIC statement, SAS version 9.3). The home location on a farm or non-farm rural environment was the dependent variable and the main components of PCoA axis scores of β-diversity matrices were the predictor variables. Bacterial and fungal microbiota were investigated separately. For both bacteria and fungi, separate models were built using axis scores from PCoA of abundance-unweighted and -weighted β-diversity matrices. The PCoA axes were selected based on the scree plot method including axes above the point at which the variance explained by the additional axes levels off (Supplementary Fig. 3). The models give an estimate of the probability that the sample is from a farm home. The farm home likeness of the microbial composition in the LUKAS2 non-farm homes was then estimated by applying the regression coefficients obtained from the LUKAS1-based models to the corresponding microbial data from LUKAS2 samples.Some analyses were performed in non-farm homes of both LUKAS2 and LUKAS1 to obtain increased sample size and power if results remain comparable as was observed. Due to the discovered association with asthma, the probability that was modeled based on the relative abundance-weighted bacterial/archaeal β-diversity was named FaRMI and was studied further in greater detail.
And isn’t that just an association that may have a rather simple explanation?
As FaRMI is weakly associated with muramic acid concentration in dust, the authors make Gram-positive bacteria responsible for the effect. The rhizosphere of soil is extremly rich of bacteria. The world's first soil atlas showed hundreds of taxa but never differentiated between water resistant, gram positive and less water resistant gram-negative taxa. Maybe Gram positive Streptococcaceae are ubiquitous and depend on where you draw your samples?
FaRMI is found in non farm / rural children by bacterial/archaeal operational taxonomic units (OTUs) of soil origin which basically confirms my initial assumption: There was the same contamination of soil both in farm and non-farm homes if we look at supplement table 6 where walking indoors with outdoor shoes results in significant higher FaRMI values…Maybe the microbiome hype is already over.
Our results warrant translational studies to confirm the causal relationship through indoor microbial exposure-modifying intervention that may also form a novel strategy for primary asthma prevention.
Good luck with your future studies.
BTW – The scripts at Github are useless references to shell and Python scripts that will never run due to “â€"” characters. And what about that baby code?
outfolder=getwd()
eigenfile <- paste(outfolder, "/", prefix, "_PCoA_eigenvalues.txt", sep="")
writerow <- paste("Eigenvalue min / max: ", min.eigen, " / ", max.eigen, sep="")
write(writerow, file=eigenfile, append=F)
writerow <- paste("Sum of all eigenvalues: ", round(neg.eigensum, digits=6), sep="")
write(writerow, file=eigenfile, append=T)
writerow <- paste("Sum of all eigenvalues (negatives as 0): ", round(nonneg.eigensum, digits=6), sep="")
write(writerow, file=eigenfile, append=T)
writerow <- "Eigenvalues (pos & neg): "
write(writerow, file=eigenfile, append=T)
writerow <- paste(pcoa$value$Eigenvalues, collapse="\t")
write(writerow, file=eigenfile, append=T)
writerow <- "Percents (Negatives as negatives): "
write(writerow, file=eigenfile, append=T)
writerow <- paste(paste(neg.percent, " %", sep=""), collapse="\t")
write(writerow, file=eigenfile, append=T)
writerow <- "Percents (Negatives as 0): "
write(writerow, file=eigenfile, append=T)
writerow <- paste(paste(nonneg.percent, " %", sep=""), collapse="\t")
write(writerow, file=eigenfile, append=T)
Using R heredoc syntax I can rewrite 20 unreadable by 8 readable lines.
tmp <- 'Eigenvalue min / max: min.eigen / max.eigen
Sum of all eigenvalues: neg.eigensum
Sum of all eigenvalues (negatives as 0): nonneg.eigensum
Eigenvalues (pos & neg): pcoa
Percents (Negatives as negatives):  neg.percent %
Percents (Negatives as 0): nonneg.percent %'
for (i in c("min.eigen","max.eigen","neg.eigensum","nonneg.eigensum","pcoa$value$Eigenvalues","neg.percent","nonneg.percent") ) { tmp <- gsub(i,get(i),tmp) }
write(tmp, file=paste(getwd(),out,"/")
And why moving to SAS for a simple logistic regression? Is there anyone else in the academic world who pays $8,700 annually for a basic SAS Windows Analytics package just for that reason?