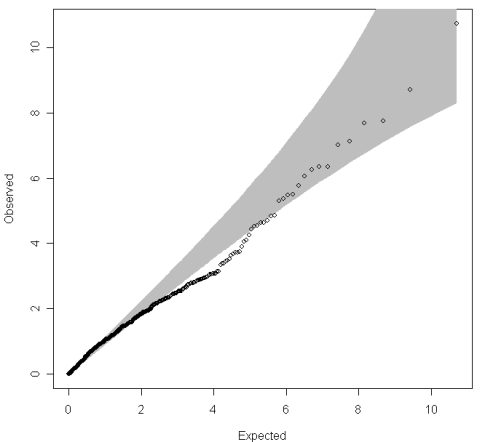
Do you wonder what QQ means? These are quantile – quantile plots that rank observed test statistics against expected test statistics. They allow a visual inspection of overdispersion due to population substructure or other sources of biases.
QQ plots have been recommended earlier, are now frequently used and available in the snpMatrix R package. Yea, yea.
CC-BY-NC Science Surf , accessed 01.04.2026, click to save as PDF