Tag Archives: temperature

Steuerung von Lüfter und Trockner im Keller

Nach einigen früheren Projekten auf Basis des Raspberry Pi Zero kommt hier nun ein viertes mit dem Temperatur und Luftfeuchte im Keller und der Aussenluft bestimmt wird. Es funktioniert auf Basis des häufig verwendeten SHTC3 Sensors.


Da die physikalische I2C Adresse des SHTC3 nicht geändert werden kann, brauchen wir zusätzlich ein Mux Board, das mit einer Lötbrücke auf dem ADR0 Jumper die Adresse von 0x70 auf 0x71 ändert.

#!/usr/bin/env python3

import csv
import board
import busio
import adafruit_shtc3
from adafruit_tca9548a import TCA9548A

def main():
  # Initialize the iic bus
  i2c = busio.I2C(board.SCL, board.SDA)

  # Initialize the TCA9548A multiplexer
  mux = TCA9548A(i2c, address=0x71)

  # Initialize the SHTC3 sensor on MUX channel 0
  shtc3_channel_0 = adafruit_shtc3.SHTC3(mux[0])

  # Initialize the SHTC3 sensor on MUX channel 1
  shtc3_channel_1 = adafruit_shtc3.SHTC3(mux[1])

  with open("/home/admin/www/taupunkt.log","a+") as out_file:
    tsv_writer = csv.writer(out_file, delimiter='\t')
    temperature0, relative_humidity0 = read_shtc3(shtc3_channel_0)
    temperature1, relative_humidity1 = read_shtc3(shtc3_channel_1)
    dt = time.strftime('%Y-%m-%d %H:%M:%S')
    tsv_writer.writerow([dt,
      temperature0,relative_humidity0,
      temperature1,relative_humidity1])

if __name__ == '__main__':
main()

Damit kann nun nach Bedarf ein Lüfter angesteuert werden, mit unter 40€ Bauteilen statt mit 570€ Fertiglösung. Als smarte Steckdosen gibt es zB die Edimax Smartplug SP1101W auf der ein Webserver läuft der curl Befehle annimmt.
CC-BY-NC

Correlation of earth temperature and global mean CO2

For teaching purposes I need the CO2 concentration vs earth temperature by year (Keeling curve). For that purpose we can use the Hadcrut 4 dataset created earlier while the global mean CO2 mix ratios (ppm) can be found at https://data.giss.nasa.gov/modelforce/ghgases/Fig1A.ext.txt.
After unscrambling that file and merging it to Hadcrut4 we can plot it

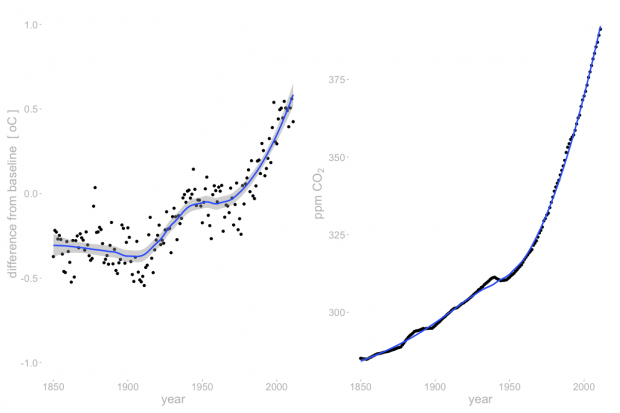
library(patchwork)
p1 <- ggplot(temp, aes(x=year, y=annual)) + geom_point() + stat_smooth(method="loess", span = .6) +
  scale_y_continuous( name="difference from baseline  [ oC ]", limits=c(-1,1) )

p2 <- ggplot(temp, aes(x=year, y=ppm )) +  geom_point() + stat_smooth(method="loess", span = .6) +
  scale_y_continuous( name=expression('ppm CO'[2]) )
p1+p2

Here are the two time courses

Time course of earth temperature (1850-2018) and CO2 (1850-2011)

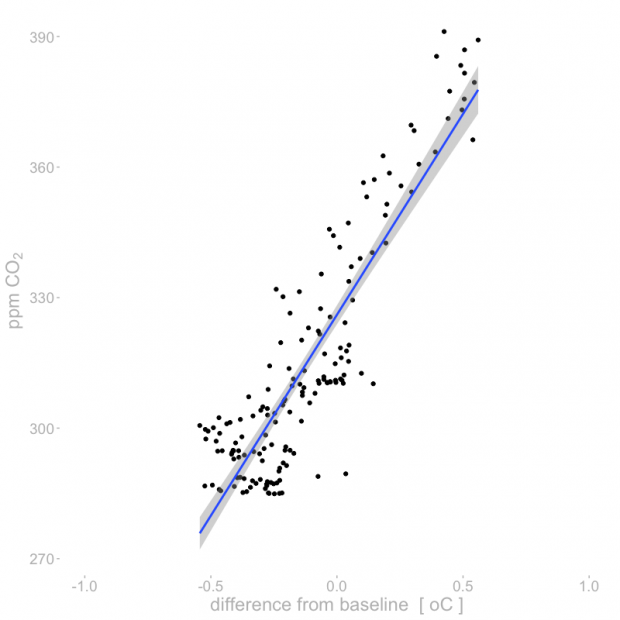
while the correlation is higher than I expected

Correlation of earth temperature and CO2


References

  • 1850-1957: D.M. Etheridge, L.P. Steele, R.L. Langenfelds, R.J. Francey, J.-M. Barnola and V.I. Morgan, 1996, J. Geophys. Res., 101, 4115-4128,”Natural and anthroupogenic changes in atmospheric CO2 over the last 1000 years from air in Antarctic ice and firn”.
  • 1958-1974: Means of Scripps Institution of Oceanography Continuous Data at Mauna Loa and South Pole provided by KenMaarie (personal communication)
  • 1975-1982: Means of NOAA/CMDL in-situ data at Mauna Loa and South Pole. (P. Tans and K.W. Thoning, ftp://ftp.cmdl.noaa.gov/ccg/co2/in-situ)
  • 1983-2003: Global means constructed using about 70 CMDL CCGG Sampling Network station data. (P.P. Tans and T.J. Conway, ftp://ftp.cmdl.noaa.gov/ccg/co2/flask)
  • 2004-2007: Global mean growth rates. (T. Conway, ftp://ftp.cmdl.noaa.gov/ccg/co2/trends)

CC-BY-NC

A new animation of the famous HadCRUT4 climate dataset

Download

Here is the R sample code (PPT aspect ratio is 6:4, Youtube wants 16:9) .

As ggplot2 animation packages have major difficulties to manipulate the single frames, I am combining here raw PNGs using ffmpeg.

# read_cru_hemi() modified from https://mccartneytaylor.com/plotting-climate-change-on-a-spider-graph-using-r

list.of.packages <- c("ggplot2", "reshape", "stringr","RColorBrewer")
new.packages <- list.of.packages[!(list.of.packages %in% installed.packages()[,"Package"])]
if(length(new.packages)) install.packages(new.packages)
lapply(list.of.packages, require, character.only = TRUE)

read_cru_hemi <- function(filename) {
  tab <- read.table(filename,fill=TRUE)
  nrows <- nrow(tab)
  hemi <- data.frame(
    year=tab[seq(1,nrows,2),1],
    annual=tab[seq(1,nrows,2),14],
    month=array(tab[seq(1,nrows,2),2:13]),
    cover=array(tab[seq(2,nrows,2),2:13])
  )
  hemi[,15:26][ hemi[,15:26]==0 ] <- c(NA)
  return(hemi)
}

url_dat <- "https://crudata.uea.ac.uk/cru/data/temperature/HadCRUT4-gl.dat"
tempdat <- read_cru_hemi(url_dat)
tempmelt <- melt(tempdat[,c(1,3:14)],id="year")

colfunc <- colorRampPalette(c("grey","grey","red"))
FadeToGrey <- colfunc(2019-1850)

new_theme <- theme_classic() + theme(
  text = element_text(size=18, colour="grey"),
  axis.line = element_blank(), 
  axis.text = element_text(colour="grey"),
  axis.ticks = element_line(colour="grey"),
  axis.title.x = element_blank(),
  panel.border = element_blank(),
  panel.grid.major = element_blank(),
  panel.grid.minor = element_blank(),
  panel.background = element_blank(),
  legend.position = "none"
)
theme_set(new_theme)

for(i in 1850:2019){
p <- ggplot(tempmelt[tempmelt$year %in% 1850:i,], aes(x=variable,y=value,color=as.factor(year),group=year)) + 
  geom_line() +
  scale_x_discrete( labels=month.abb) +
  scale_y_continuous( name="difference from baseline  [ oC ]", limits=c(-1,1) ) +
  annotate("text", x=11, y=1, label=i, size=7) +
  scale_color_manual( values=FadeToGrey[ 1:c(i-1849) ]  )
  fn <- paste("/Users/xxx/Desktop/X/",str_pad(i-1849, 3, pad = "0"),".png",sep="")
  ggsave(p, file=fn, width = 16, height = 9)
}

# not run
# ffmpeg -framerate 10 -i /Users/xxx/Desktop/X/%3d.png -r 5 -pix_fmt yuv420p -y /Users/xxx/Desktop/X/out.mp4


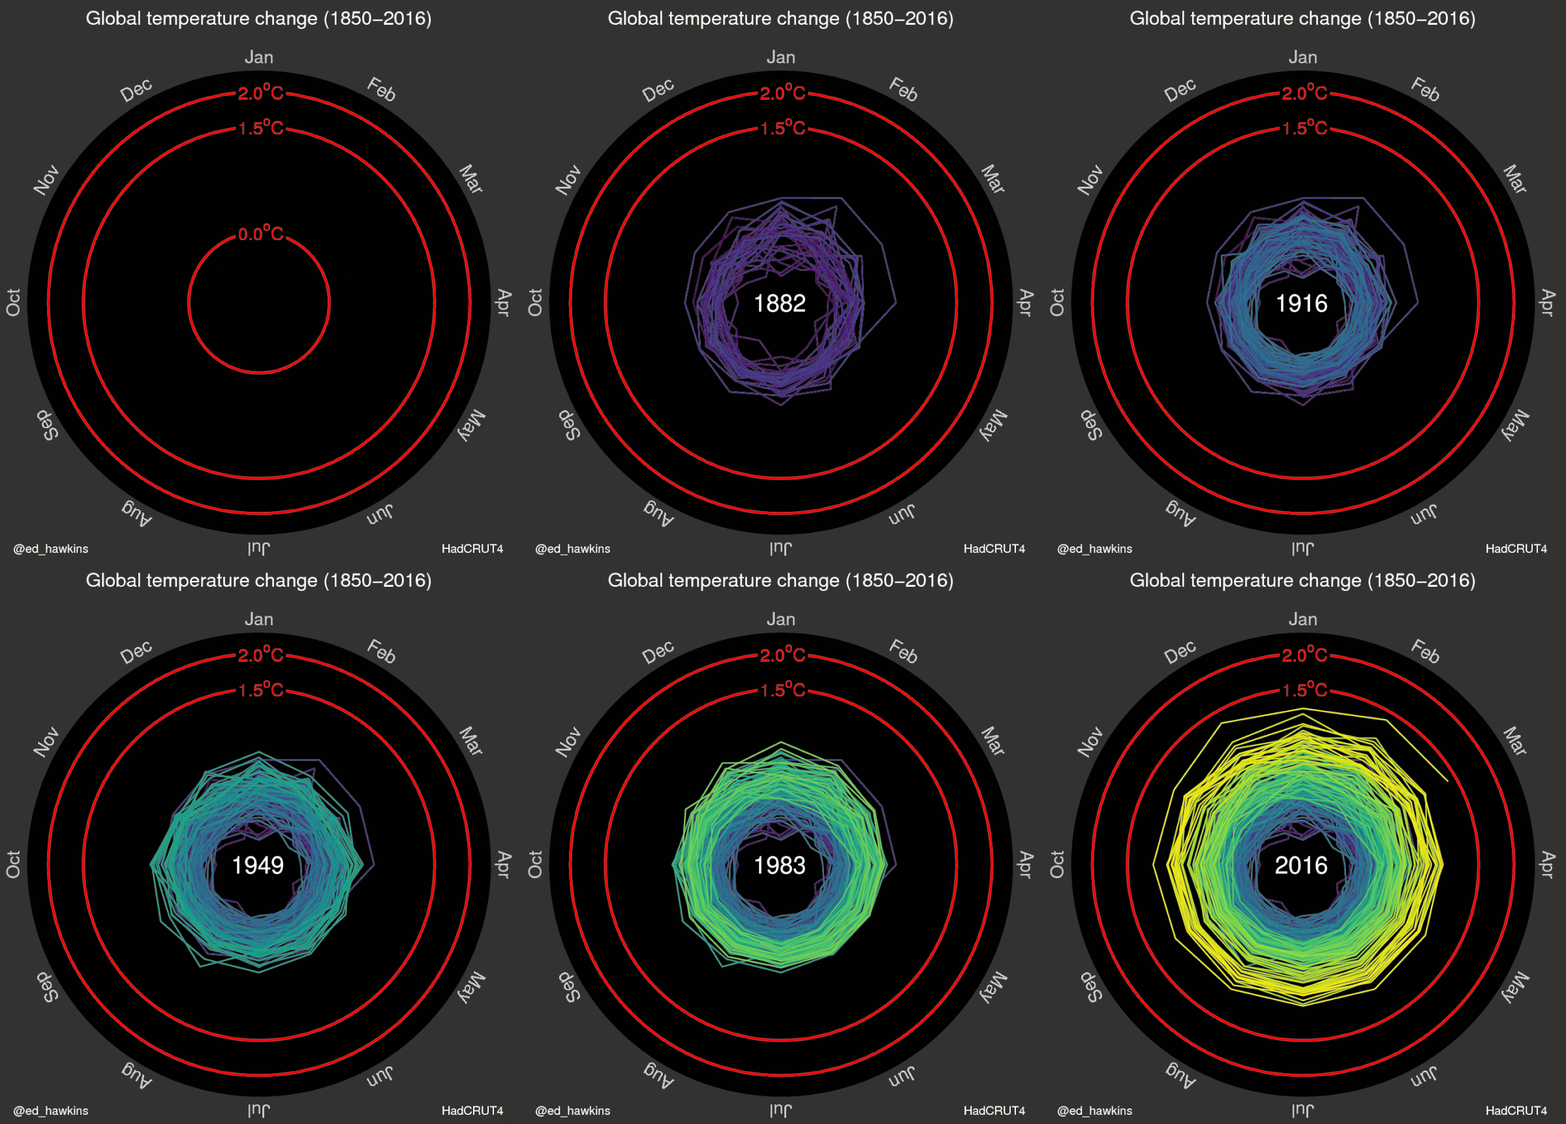
In comparison here is the original circular plot. Would require blue, green, yellow, red in the Color Ramp Palette…


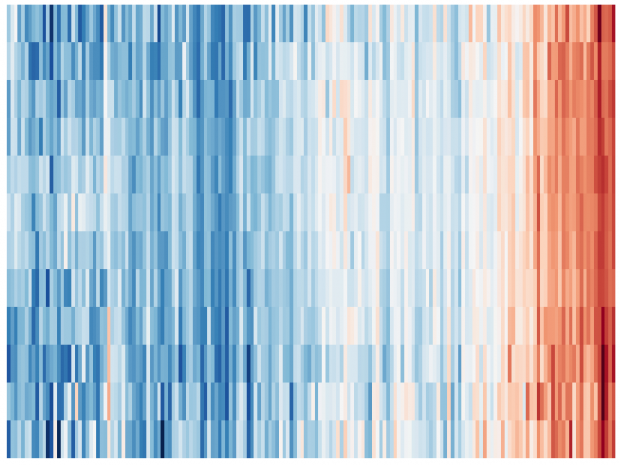
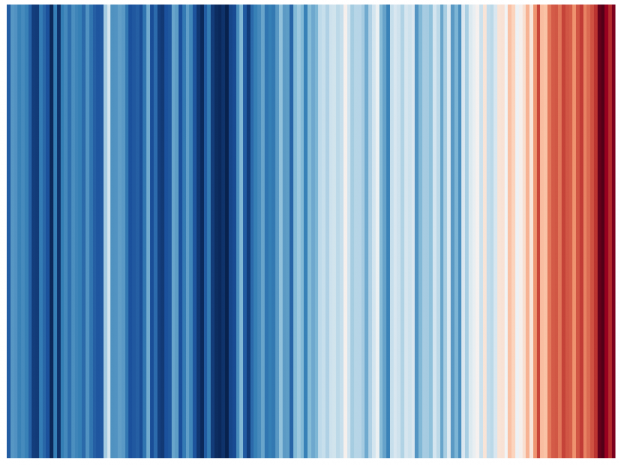
Now it is only a minor step to the warming strips.

ggplot(tempdat, aes(x = year, y = 1, fill = annual))+
  geom_tile()+
  scale_y_continuous(expand = c(0, 0))+
  scale_x_continuous(expand = c(0, 0))+
  scale_fill_gradientn(colors = rev(col_strip)) +
  guides(fill = guide_colorbar(barwidth = 1)) +
  theme( axis.ticks= element_blank(),
         axis.text = element_blank(),
         axis.title = element_blank()
  )

tempmelt$variable <- as.numeric(str_replace(as.character(tempmelt$variable),"month.",""))
ggplot(tempmelt, aes(x = year, y = variable, z = value)) +
  geom_raster(aes(fill = value)) +
  scale_fill_gradientn(colors = rev(col_strip)) +
  scale_x_continuous(expand = c(0,0)) +
  scale_y_continuous(expand = c(0,0)) +
  theme( axis.ticks= element_blank(),
         axis.text = element_blank(),
         axis.title = element_blank()
  )


CC-BY-NC