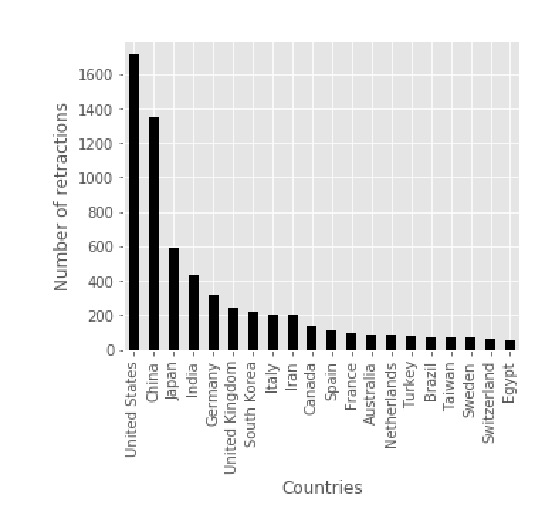
Just out of curiosity, after Scihub now an analysis of papers commented at the PubPeer website. Pubpeer is now also screened on a regular basis by Holden Thorp, the chief editor of Science…
Unfortunately I am loosing many records for incomplete or malformed addresses, while some preliminary conclusions can already be made when looking at my world map.
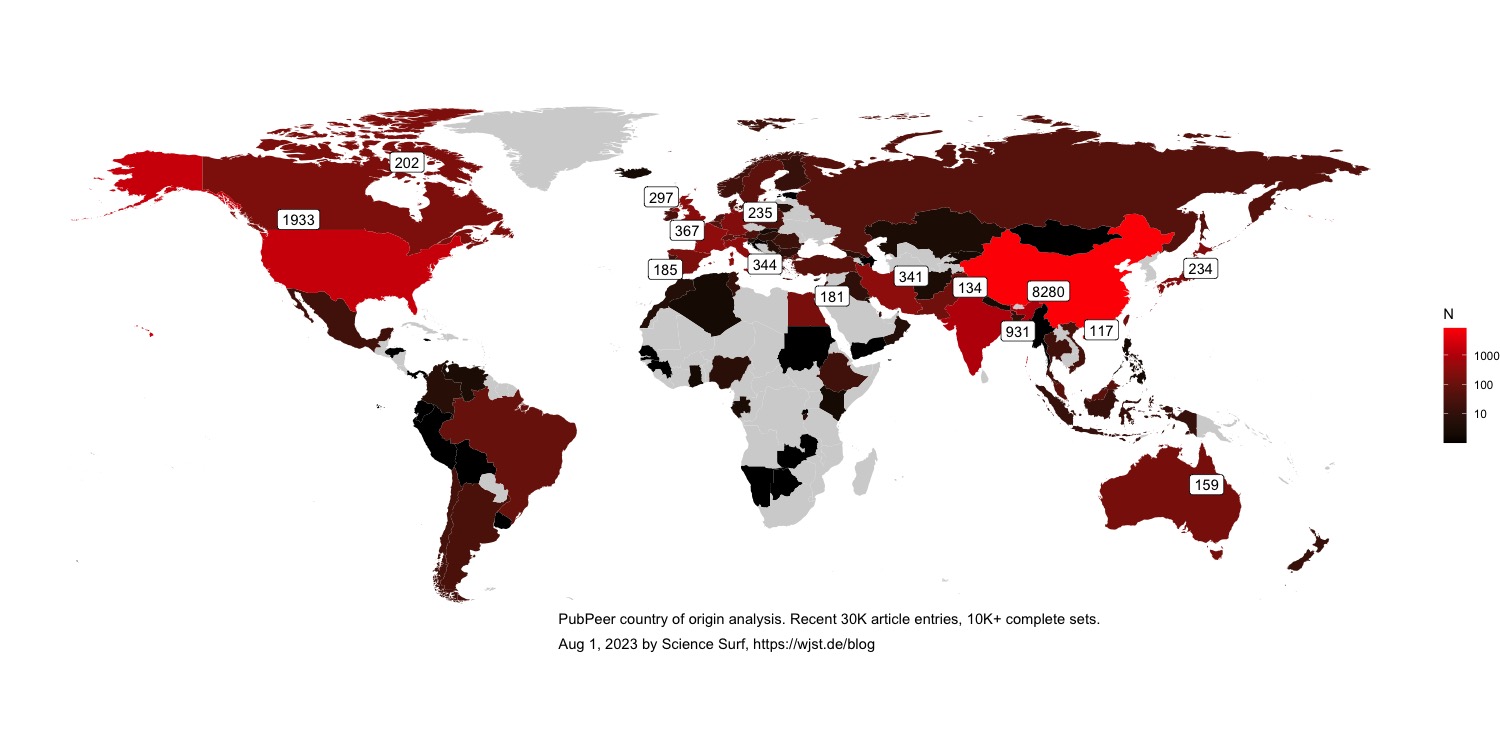
A further revision will need to include more addresses and also overall research output as a reference.
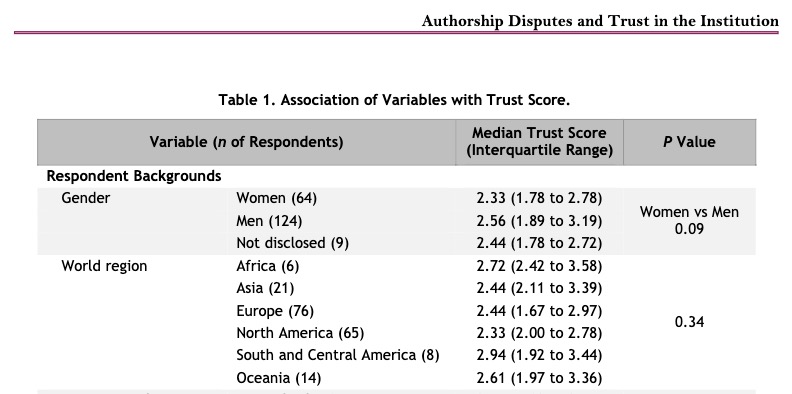
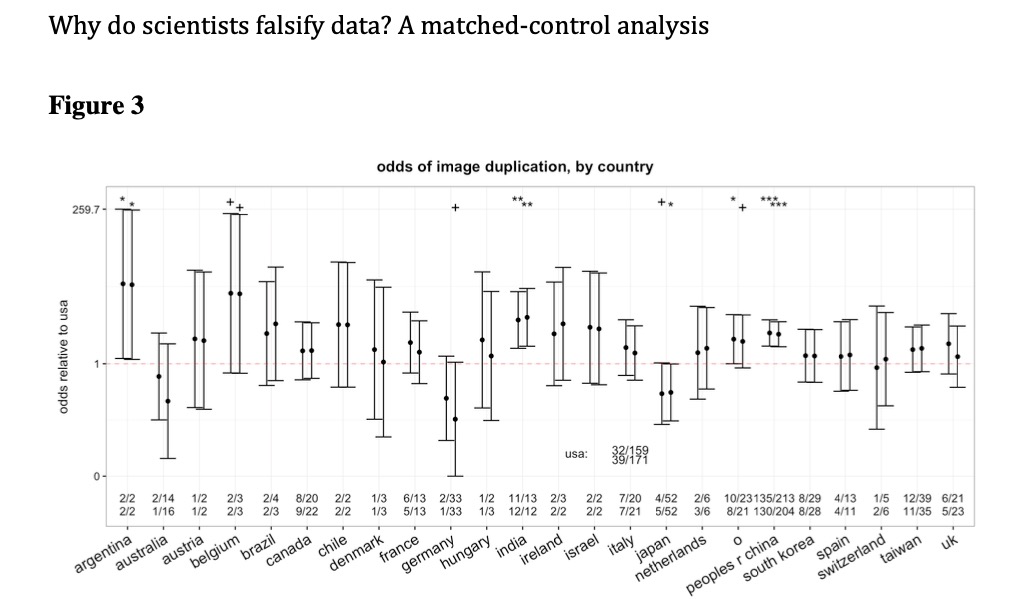
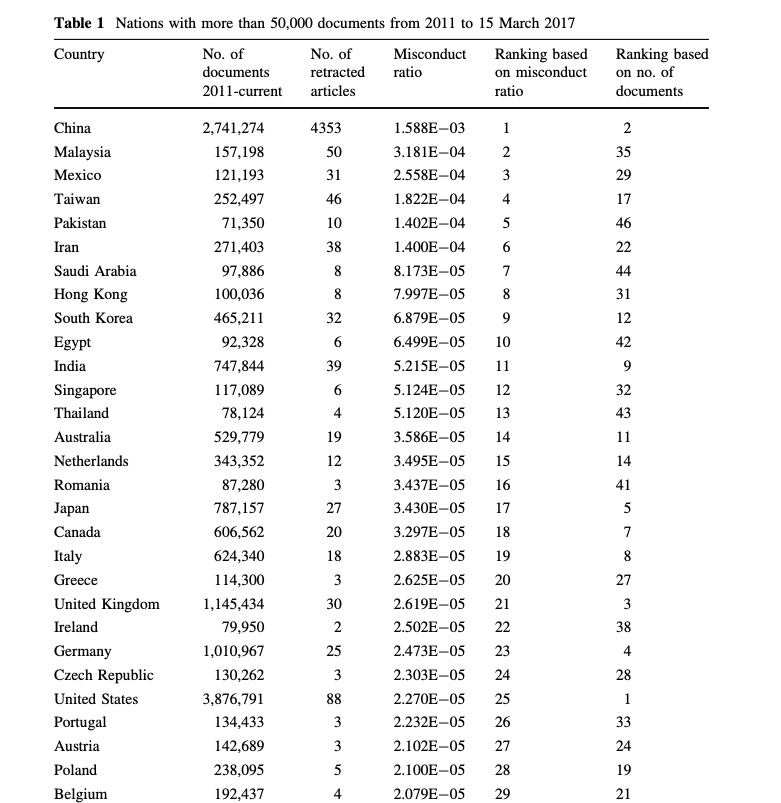
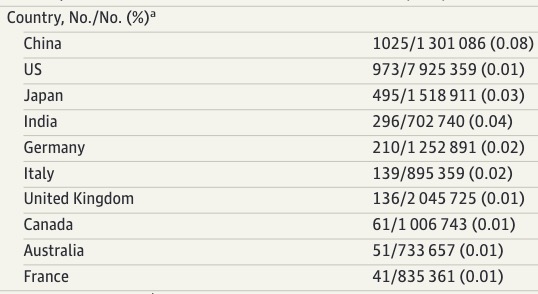
Other country level data are also interesting. Just to name a few
1/
2/
3/
4/
5/
pubpeer[,"affiliation_list"] %>%
	(function(x) {
		strsplit(x,",") %>% sapply(., tail, 1) %>% unlist()
	}) %>%
	word(.,-1) %>%
	as_tibble() %>%
	mutate(value = gsub("[\\.]+", "",value)) %>%
	mutate(value = gsub("PR.*", "China",value)) %>%
	mutate( value = case_when
		(value== "" ~ NA,
		value== "States" ~ "USA",
		value== "University" ~ NA,
		value== "Republic" ~ NA,
		value== "ROC" ~ NA,
		value== "and" ~ NA,
		value== "Maryland" ~ "USA",
		value== "(mainland)" ~ "China",
		value== "Kong" ~ "HongKong",
		value== "Chemistry" ~ NA,
		value== "Engineering" ~ NA,
		value== "PAK" ~ "Pakistan",
		value== "Arabia" ~ "South Arabia",
		value== "Sciences" ~ NA,
		value== "Technology" ~ NA,
		value== "Medicine" ~ NA,
		value== "NY" ~ "USA",
		value== "America" ~ "USA",
		value== "York" ~ "USA",
		value== "Massachusetts" ~ "USA",
		value== "Hospital" ~ NA,
		value== "Zealand" ~ "New Zealand",
		value== "Pennsylvania" ~ "USA",
		value== "Africa" ~ "South Afria",
		.default = value)) %>%
	group_by(value) %>%
	count(value) %>%
	arrange( desc(n) ) %>%
	rename(region=value) %>%
	right_join(map_data('world'), by="region" ) %>%
	filter(region != "Antarctica") %>%
	ggplot() +
	geom_polygon(aes(long, lat, group = group, fill = n)) +
	coord_quickmap() +
	scale_fill_gradient(name = "N", trans = "log10", breaks = c(10,100,1000), low = "black", high = "red", na.value = "lightgrey") +
	theme_void()
CC-BY-NC Science Surf , accessed 09.07.2026