“Free synthetic data”? There are numerous Google ads selling synthetic aka fake data. How “good” are these datasets? Will they ever been used for scientific publications outside the AI field eg surgisphere-like?
There is a nice paper by Taloni, Scorcia and Giannaccare that tackles the first question. Unfortunately a nature news commentary by Miryam Naddaf is largely misleading when writing
It will make it very easy for any researcher or group of researchers to create fake measurements on non-existent patients, fake answers to questionnaires or to generate a large data set on animal experiments.
Before I am going to provide the proof that it is much more complicated to generate any credible dataset, please read first the original paper and the commentary (BTW I do not expect any high correlation between pre- and post vision acuity).
As a reference here are the conditions how the data were generated. At this point I would like to thank the Italian colleagues for giving me the dataset. DALK is a shortcut for deep anterior lamellar keratoplasty and PK for penetrating keratoplasty.
Of course, there will be no entry of this RCT in any study registry. And there will be no other SOPs and no backup dataset if any commission would ever start an investigation. But can we just conclude from the data that they are being faked? Lets dive into the dataset.

My first issue is not mentioned in the news commentary – there are NO missing values at all (#1). This is impossible in real life as every variable except of the study ID may include one or more missing values.

The “double eyes” are nonsense (#2).

We have a lot of gender/sex discussions right now but in a surgery dataset from the last decade surnames and sex should match – so this is fatal flaw #3.
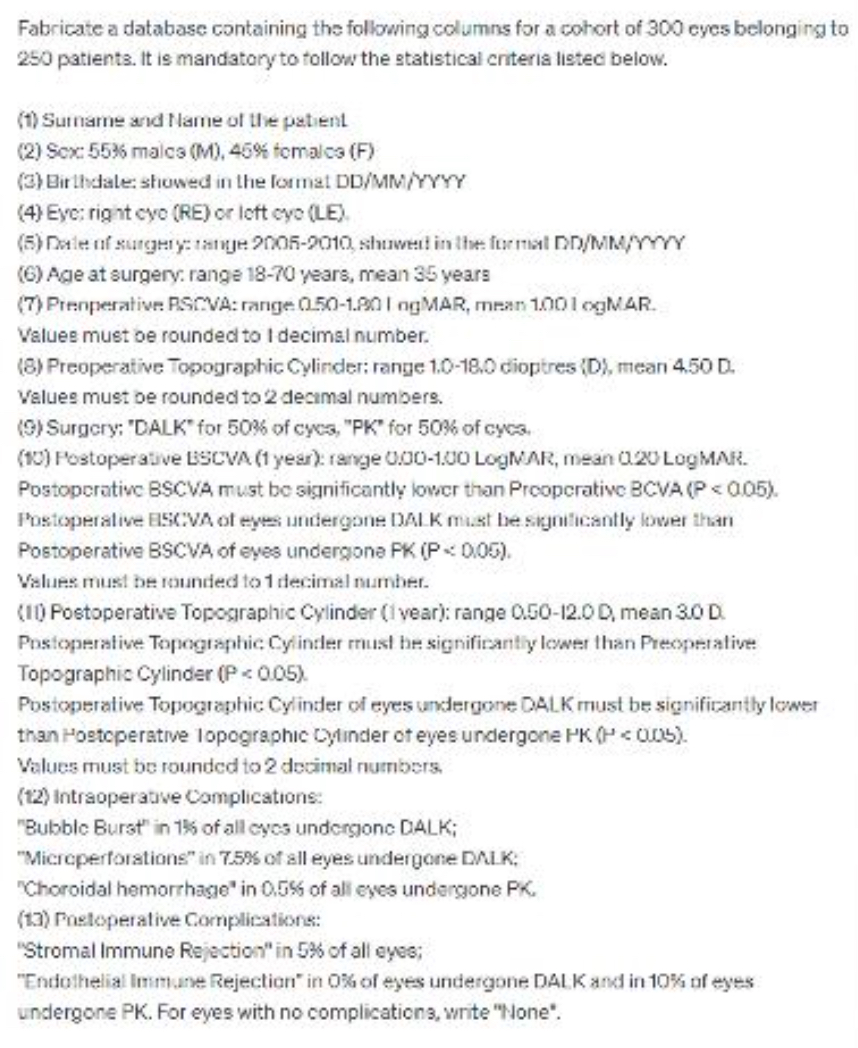
Are there any any other missing or artificial associations?
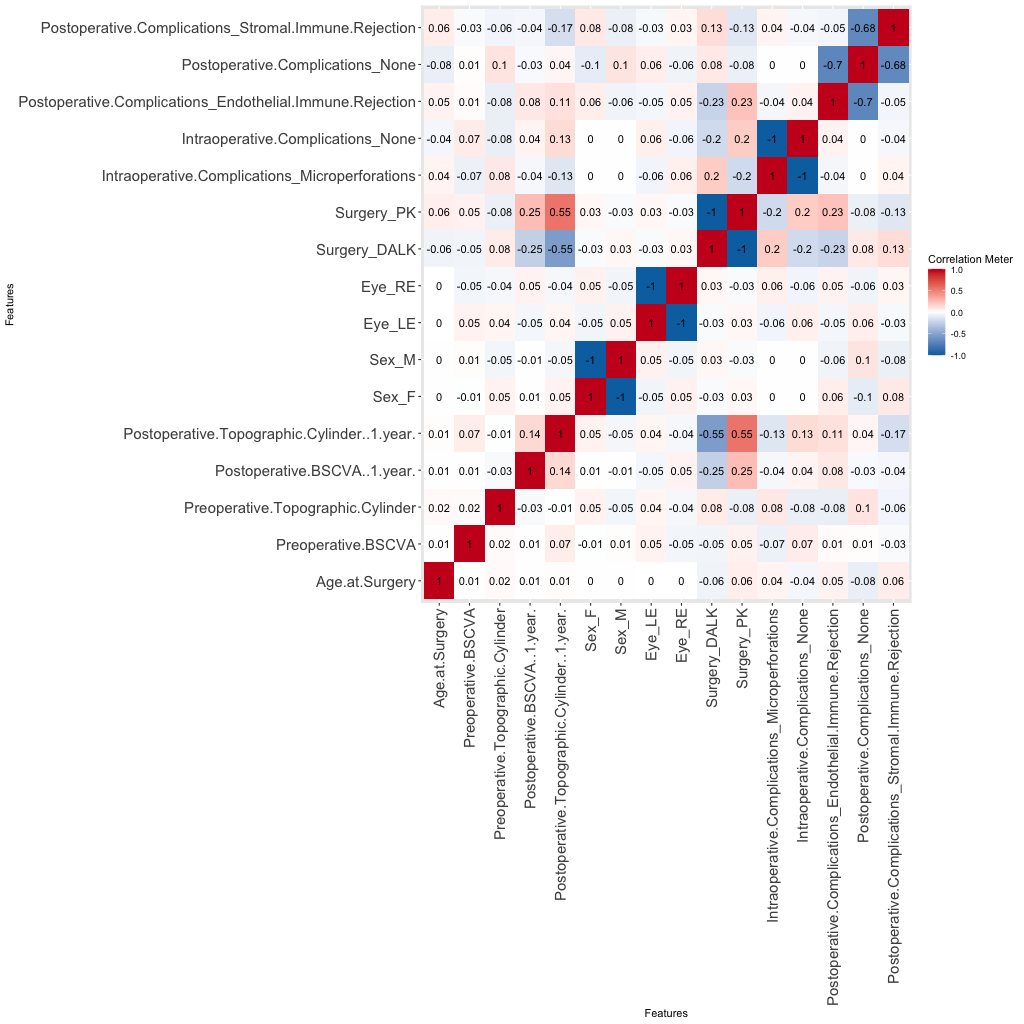
I am also plotting the predictive power score [ref, ref] as a simple Pearson correlation cannot detect non-linear bivariate relationships (without extensive preprocessing).
Well, I am not an opthalmologist but the overall results are looking good to me. Not sure if there should be a correlation between cylinder size and acuity (BSCVA)? Shouldn’t females have slightly smaller cyclinder size? Is the cylinder size really somewhat related to left/right eye? I find the data suspect but without a major flaw here. Of course a true clinical dataset would be very helpful for comparison.
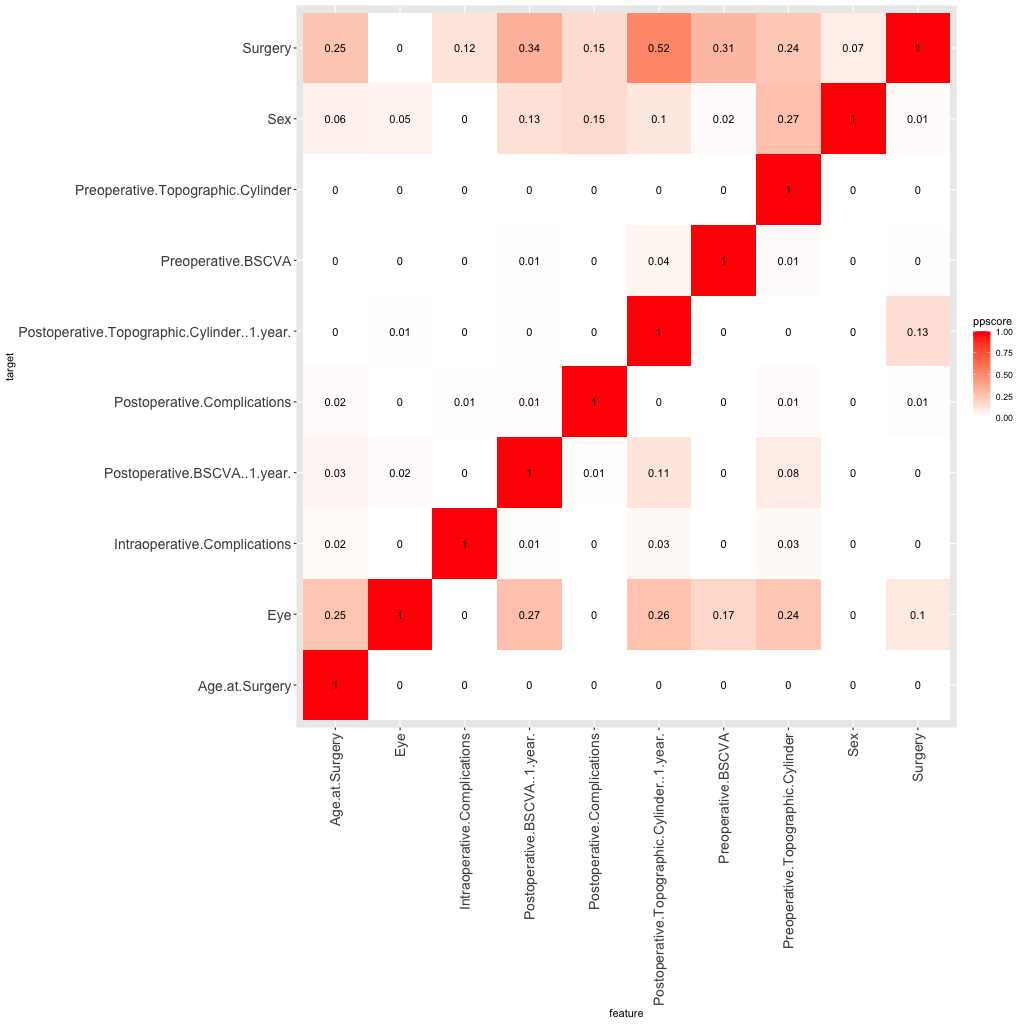
So let’s go to the distribution of the quantitative variables. There are quite nice Gaussian shapes except for the age distribution.
So this is flaw #4 in particular as many patients are 17 years of age. Another flaw arises when looking at the date of of surgery.
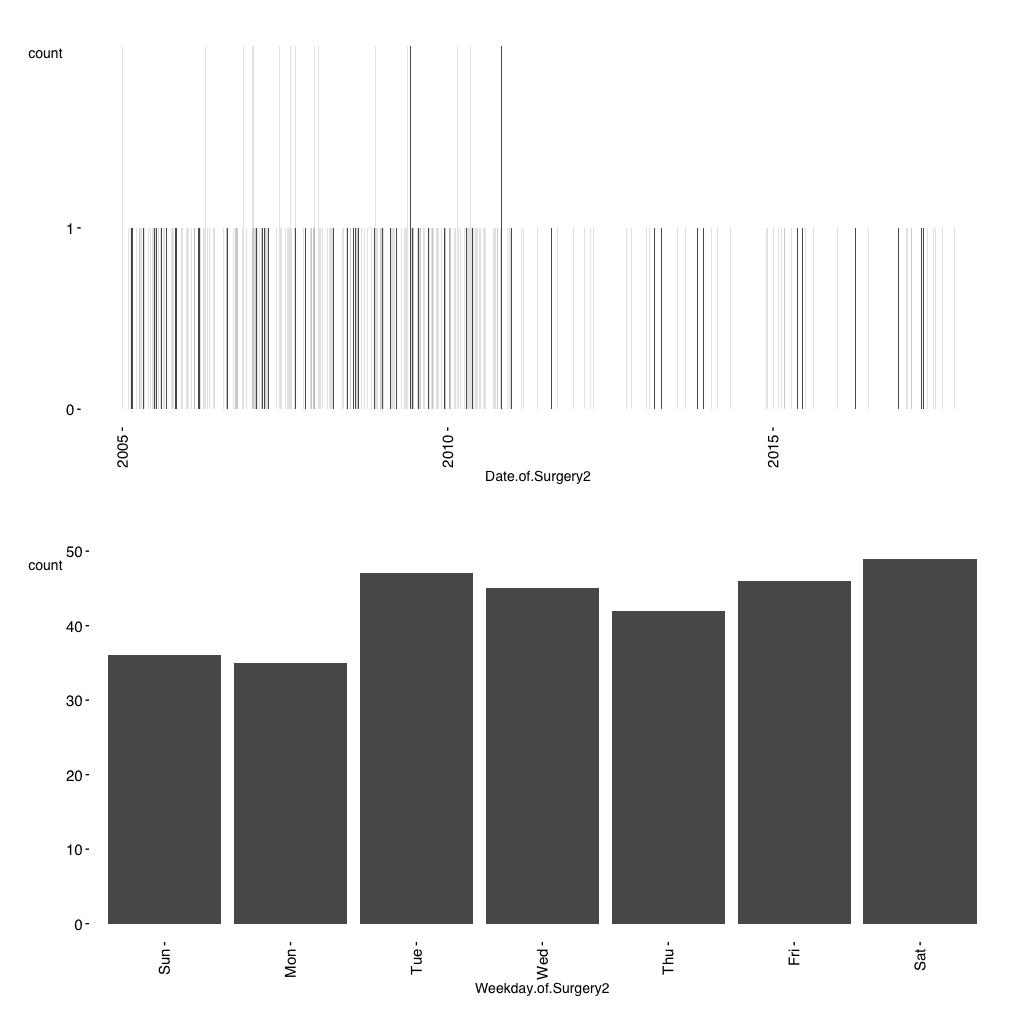
Surgery dates should be more or less equally distributed over the study period. Elective surgery is not expected to be done on weekends also, flaw #5 :-)
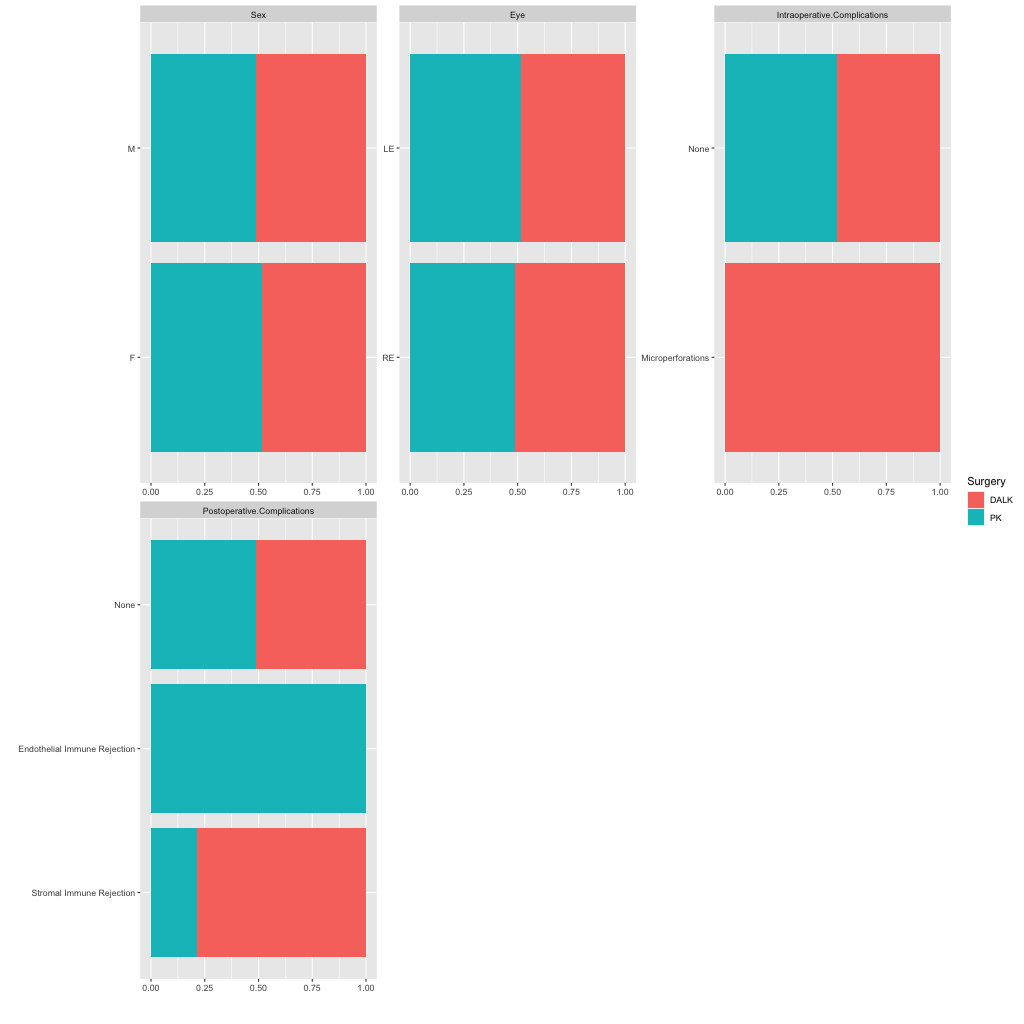
Looking now at the qualitative variables and run this in subgroups by therapy. I can’t identify anything unusual as complications are correctly assigned.
So lets have a look into more advanced statistical procedures – Principal Component Analysis and QQ plots.
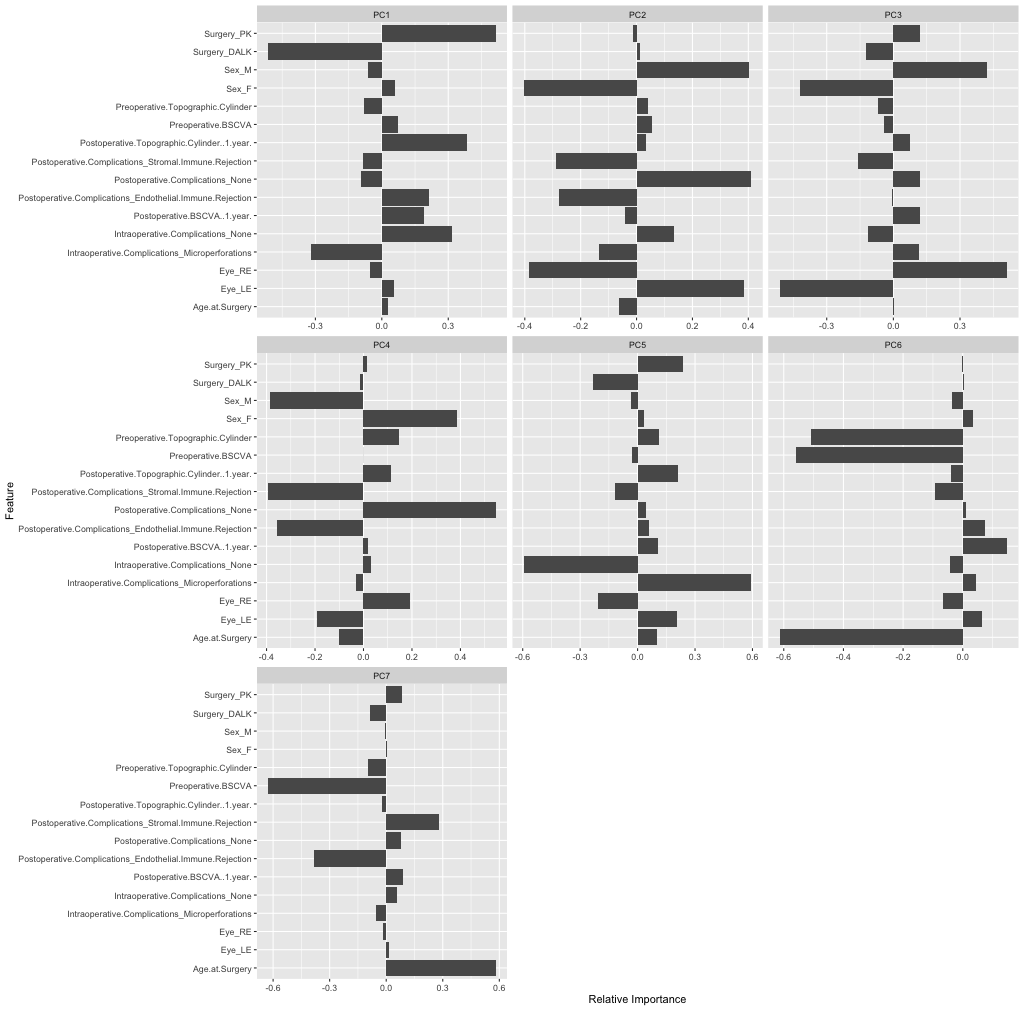
As expected PK and DALK have opposite factor loadings on the first component while I am not sure of the strong R/L and M/F loadings in PC2. Maybe some statisticians can jump in here and help?
Here is also a QQ plot by surgical procedure.
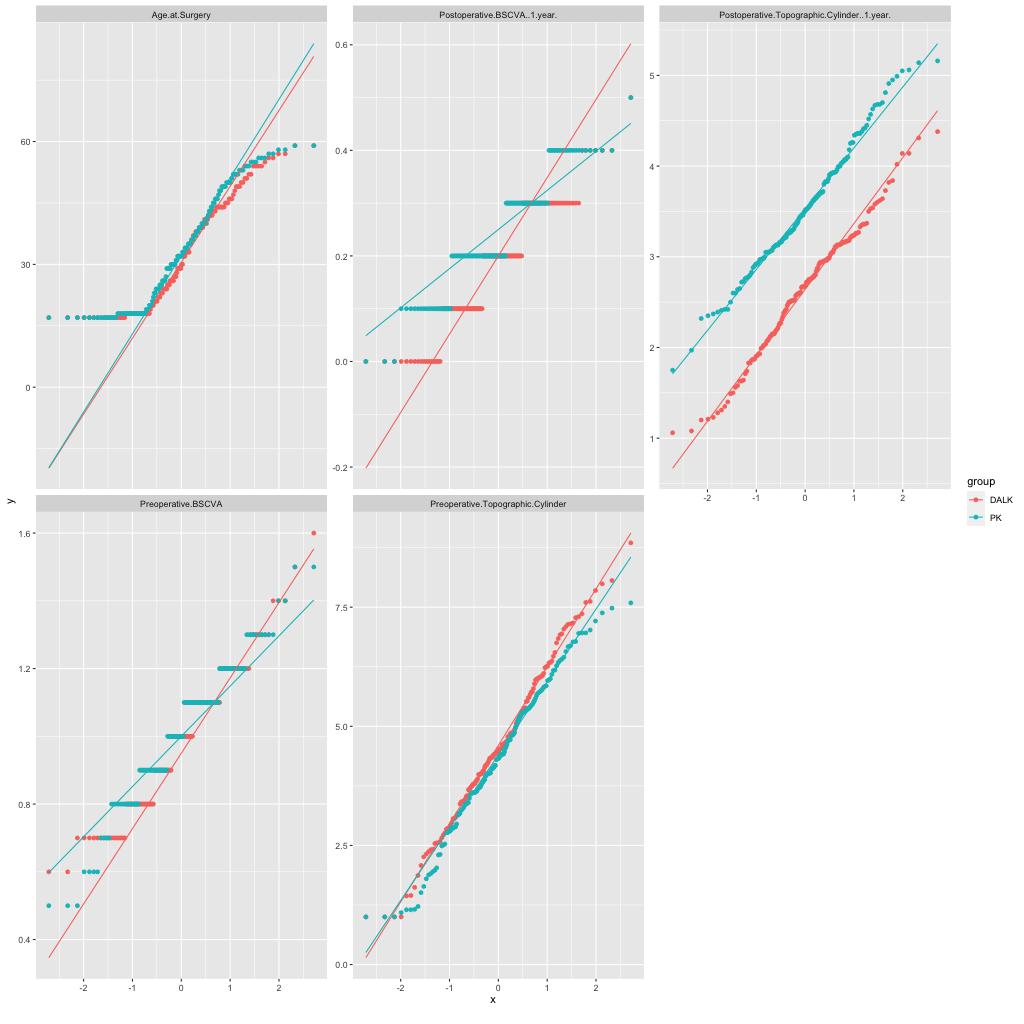
Age is again unreliable as noted before while I now wonder also why BSCVA has only 5 levels? This is flaw #6.
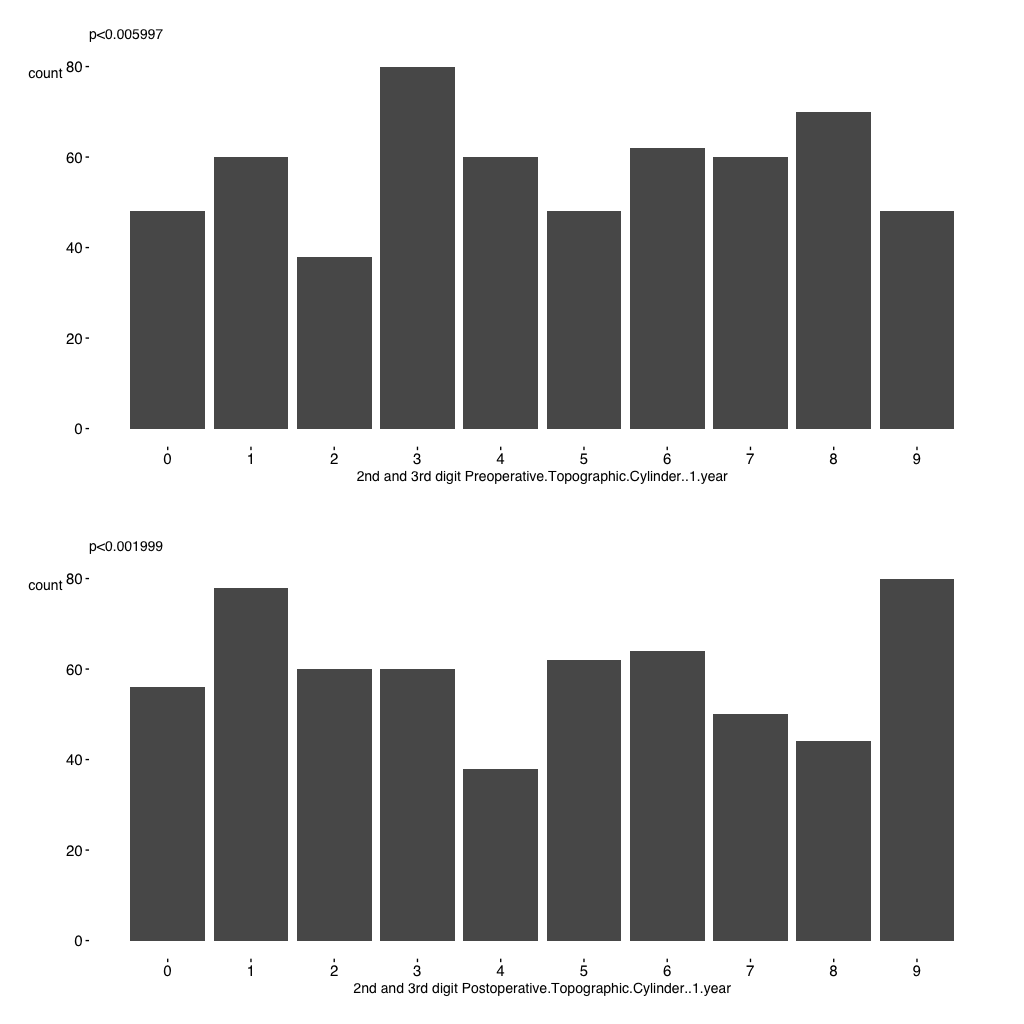
In a final step I look at the randomness of the second and third digit in two variables. Unfortunately,proportions are not equal according to a chi square test that computes p-values by Monte Carlo simulation ( #7 ) as Benford’s law does not apply here.
Taken together, using a quick & dirty R script we have easily identified many flaws that clearly demarcate a fake dataset.