Tag Archives: statistics

Scientific integrity investigators are the last resort

It's basically the same scene – backoffice journalists are fact checking reports. OSINT experts are verifying satellite and ground images. Science sleuths reanalyze numbers and tables in scientific publications. The stakes are high as integrity investigators are the last resort, the papers have passed already all quality checks at journals. It is a bit like the old "sub umbra dei" saying, there is only god behind them. And there is no room for error.

In the science integrity scene there are many mavericks or let's say colorful people. Most come from inside academia, starting or ending a career there. Some are from far outside it, and their motives are ranging from methodological curiosity, financial gain to personal grievance. What holds the field together is therefore not a shared background but a shared refusal to accept a published claim on authority of a journal alone. That heterogeneity is a strength for detection but also a weakness for credibility, because any single overreaching claim by one investigator is readily used to discredit the rest as "Pubpeer Mob". Again the stakes are high: A minor error in a published paper costs the author a correction. An unfounded allegation can cost a career, and it costs the field its licence to speak out. That asymmetry sets the working rules. There are no ten commandments but there are some working rules.

Methodological rigour comes first: every claim must be stated so that a third party can check it against the same source material and arrive at the same result. Image duplications get exact border coordinates, statistical objections need the extracted values on which a test was run. An eyeballed duplication anomaly is not a finding per se. Distribution checks only carry weight when the reported summary statistics, rounding conventions and sample sizes are documented well enough for someone else to replicate them. Replication is key not only for original work but also for post publication review.

Relevance is also a filter as much as rigour is. Typographical slips, reference-list errors, image panel mix up and stylistic issues dilute the serious concerns and shift the discussion from the science to the tone of the critic. These errors are annoying of course and do not add to the credibility of authors. But what really matters is whether a defect could change the value of a report and its conclusions: fabricated or duplicated data, misinterpreted assays and conditions, results incompatible with the stated design, analyses that cannot have produced the reported numbers, undisclosed conflicts that are directly related on interpretation. These are the high scores not the 1,800 issues produced by some automated software tool.

Everything else stays out. Statements about what the authors intended, whether they are competent, or what a pattern of errors implies about them are not verifiable. Even subtle threats are inappropriate; jokes and sarcastic comments are not wanted, I have learned that in the past. The finding that some numbers do not reconcile, that images have been used before, that the trial registration postdates the enrollment: this is the relevant stuff. Whether this arose from fraud, sloppiness, wrong antibody batch or software error is for the institution or editorial staff to verify, not for the sleuth writing the comment. Only journals, institutions or courts can ask questions that must be answered; the sleuth can document, but cannot compel a response. Usually he never gets access to raw data, neither can he interview a senior coauthor or a president which remains in the domain of journalists.

That limitation is worth holding on up, because it defines what a post-publication review can honestly claim: the published record, as it stands, does not add up. It can classify the level of the integrity violation but not claim to know why an issue occured. Fervour is the occupational hazard of the integrity field that is damaging: the investigator who is right about 99 findings and overstates the hundredth hands every previously criticised author a reason to dismiss the rest.

Restraint is not politeness, it is the condition under which the work retains its force.
 

CC-BY-NC Science Surf , accessed 19.09.2026

Is there a data agnostic method to find repetitive data in clinical trials?

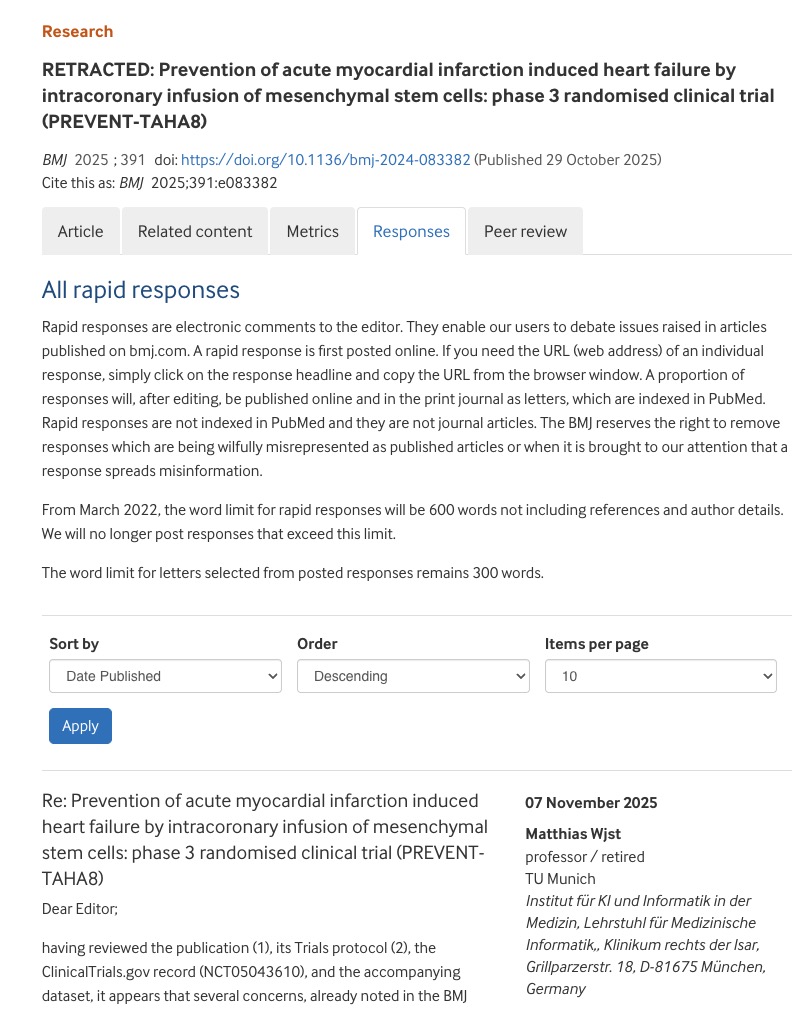
There is an interesting observation by Nick Brown over at Pubpeer who analysed a clinical dataset (see also my comment atthe BMJ)

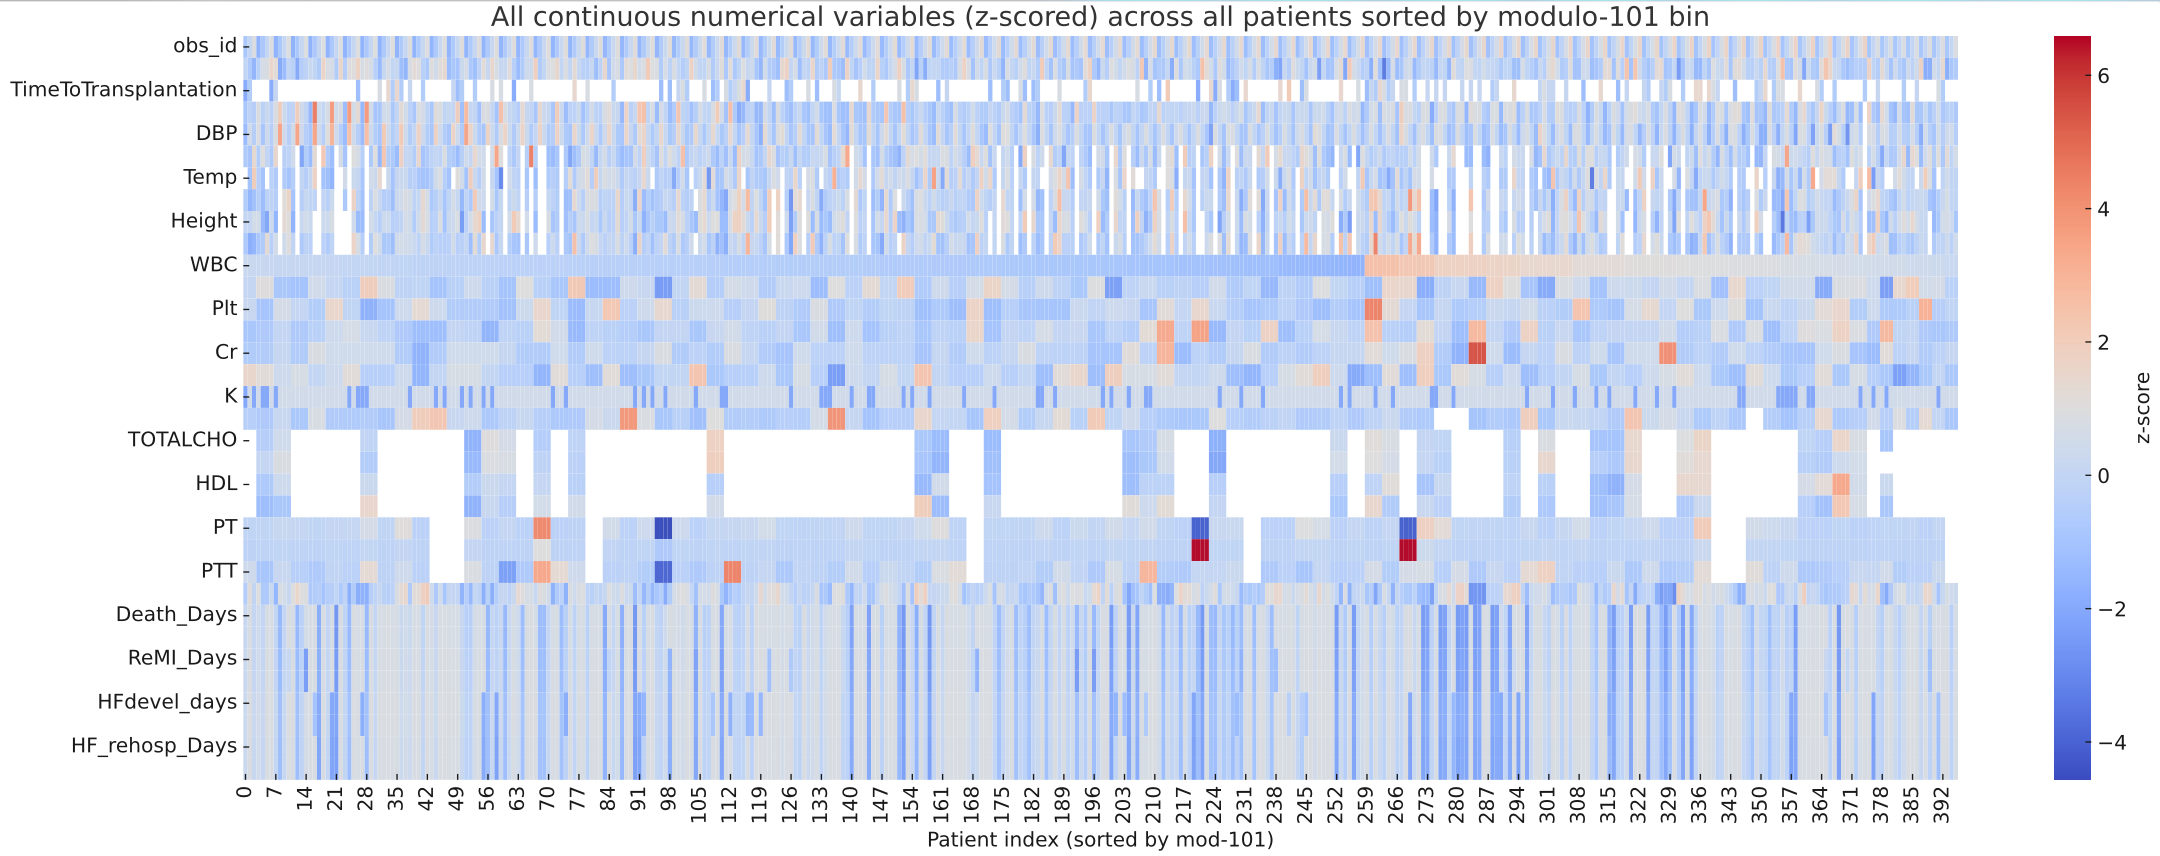
…there is a curious repeating pattern of records in the dataset. Specifically, every 101 records, in almost every case the following variables are identical: WBC, Hb, Plt, BUN, Cr, Na, BS, TOTALCHO, LDL, HDL, TG, PT, INR, PTT

which is remarkable detective work. By plotting the full dataset as a heatmap of z scores, I can confirm his observation of clusters after sorting for modulo 101 bin.

How could we have found the repetitive values without knowing the period length? Is there any formal, data-agnostic detection method?

If we even don’t know the initial sorting variable, it may makes sense to look primarily for monotonic and nearly unique variables, i.e. that are plausible ordering variables. Clearly, that’s obs_id in the BMJ dataset.

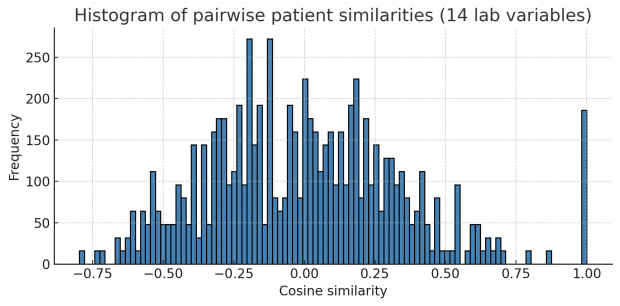
Let us first collapse all continuous variables of a row into a string forming a fingerprint. Then we compute pairwise correlations (or Euclidean distances in this case) of all fingerprints. If a dataset contains many identical or near-identical rows, we will see a multimodal distribution of correlations plus an additional big spike at 1.0 for duplicated rows. This is exactly what happens here.

Unfortunately this works only when mainly repetitive variables are included and not too many non repetitive variables.

Next, I thought of Principal Component Analysis (PCA) as the identical blocks may create linear dependencies and the covariance matrix is becoming rank-deficient. But unfortunately results here were not very impressive – so we better stick with the cosine similarity above.

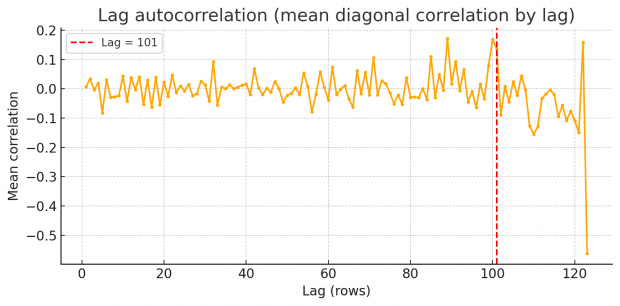
So rest assured we find an excess of identical values, but how to proceed? Duplicates spaced by a fixed lag will cause an high lag k autocorrelation in each variable. Scanning k=1...N/2 reveals spikes at the duplication lag as shown by a periodogram of row-wise similarity in the BMJ dataset.

So there are peaks at around 87, 101 and 122. Unfortunately I am not an expert in time series or signal processing analysis. Can somebody else jump in here and provide some help with FFT?

There may be even an easier method, using the fingerprint-gap . For every fingerprint that occurs more than once, we sort those rows by obs_id and compute the differences of obs_id between consecutive matches. Well, this shows just one dominant gap at 101 only!

We could test also all relevant mod values, lets say between 50 and 150. For each candidate we compute the across-group variance of the standardized lab-means. The result is interesting

Modulus 52: variance = 0.084019
Modulus 87: variance = 0.138662
Modulus 101: variance = 0.789720

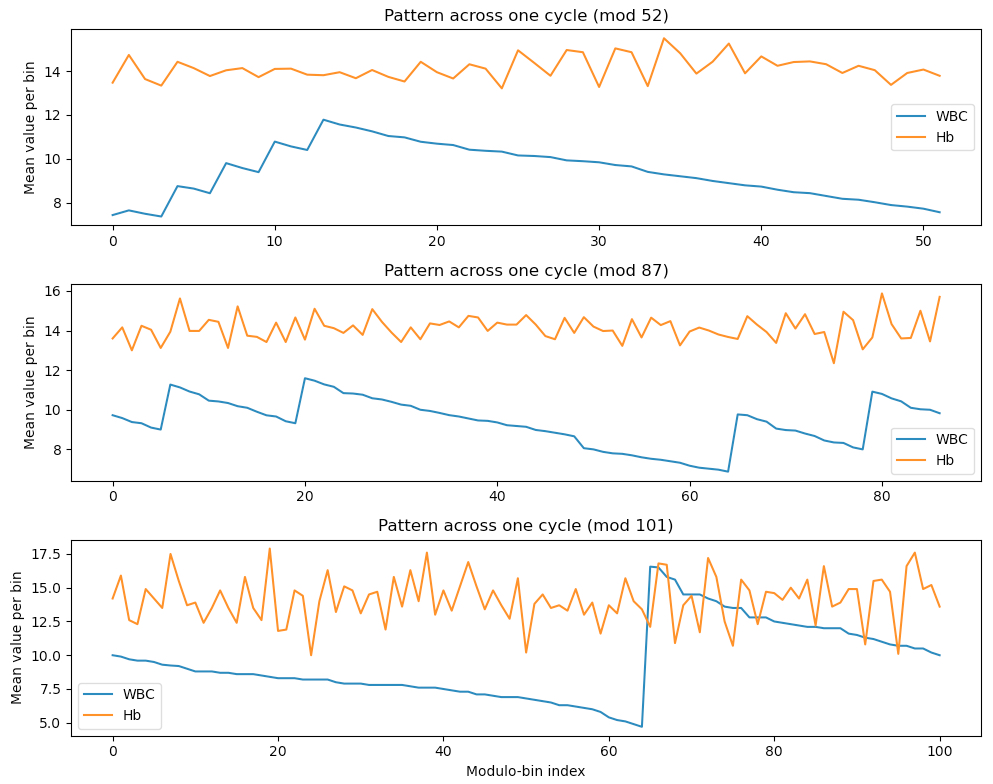
As a cross check let us look into white blood cell counts (WBC) and hemoglobin (Hb).

I am not sure, how to interpret this. Mod 52 may reflect shorter template fragments but did not show up in the autocorrelation test. Mod 87 has rather smooth, coherent curve and is supported by autocorrelation. Mod 101 is more noisy, but gives probably the best explanation for block copying values. Maybe the authors block copied at two occasions?

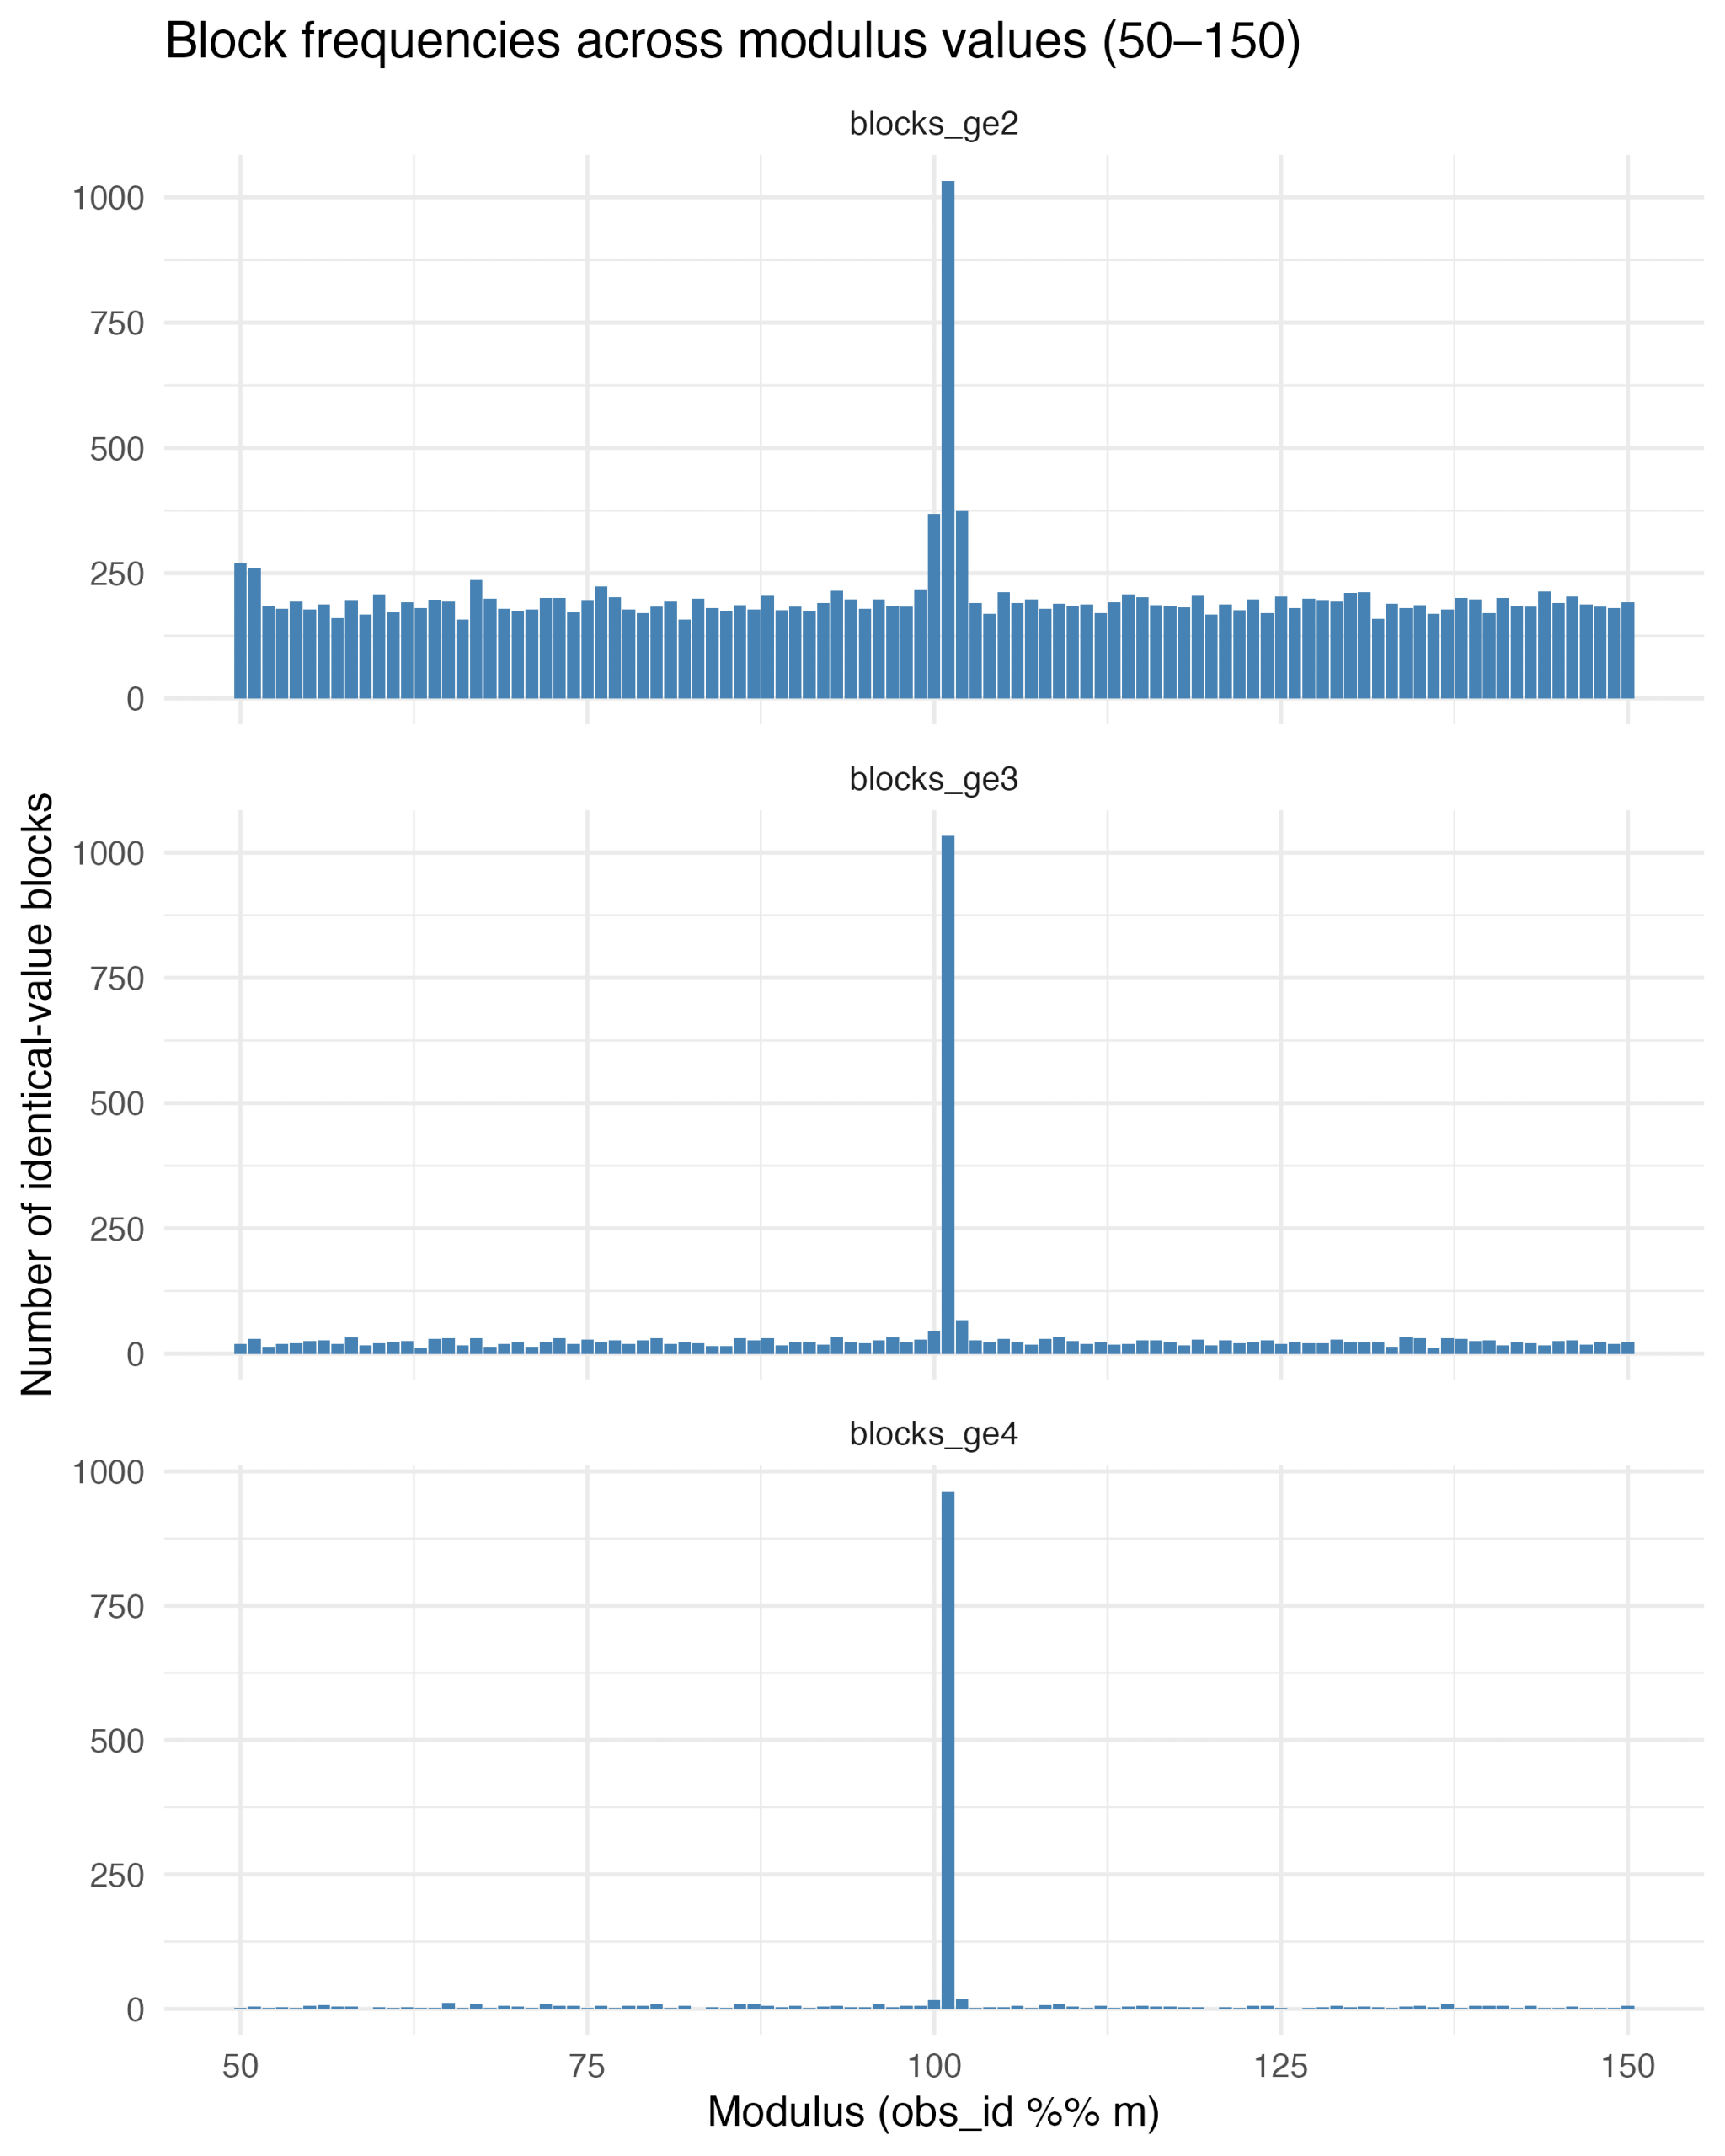
On the next day, I thought of a strategy to find the exact repetition numbers. Why not looping over mod 50 through 150 and just count the number of identical blocks? This is very informative – blocks of size 2, size 3 and 4 or greater show an exact maximum at modulus 101.


23.3.2026 Appendix

There seems many more studies out there with copy-pastein signs including a Parkinson Cell paper, a PLoS Genetics toxicology paper and a Nat Comm fish ecology study. Here is the Github link to the implementation by Markus Eglund

Hopefully I get the pipeline right by summarizing the entropy calculation there. This is not Shannon entropy – it is a custom measure of how informationally surprising a raw number is. The logic is:

  • Strip the decimal point and trailing zeros from the number’s string representation, then take the absolute integer value. So 0.314 → 314, 0.500 → 5 (trailing zeros stripped), 2016 → 16 (year exception: years 1900-2030 get a capped entropy of 100).
  • Apply a log-scaled transformation: values below 100 get log10(value); values up to 100,000 get 5×log10 - 8; larger values get log10 + 12.
  • For column sequences, sum the individual entropy scores of each value in the run.
  • Adjust downward for “regularity” – if the values in a sequence follow a regular arithmetic interval (e.g. 1.0, 2.0, 3.0), the score is reduced proportionally, because regular sequences can appear legitimately.
  • Normalise by logNumberCountModifier (log of the total number of numeric cells on the sheet) so large sheets don’t get disproportionately penalised.

The suspicion grades are fixed thresholds on the resulting normalized score. I will add the strategy to my Python script (it is implemented here in type script) as another module and upload to Github once it has been sufficiently tested.

31.3.2026 Appendix

PREVENT-TAHA8, the starting point of this analysis, has been retracted today. I will give a presentation on the avalanche, that has been triggered by this paper, on 29-31 July 2026 in Hannover.

Screenshot 31/3/26


CC-BY-NC Science Surf , accessed 19.09.2026

Cause and effect in observational data: Magic, alchemy or just a new statistical tool?

Slashdot has a feature on that

Statisticians have long thought it impossible to tell cause and effect apart using observational data. The problem is to take two sets of measurements that are correlated, say X and Y, and to find out if X caused Y or Y caused X. That’s straightforward with a controlled experiment… But in the last couple of years, statisticians have developed a technique that can tease apart cause and effect from the observational data alone. It is based on the idea that any set of measurements always contain noise. However, the noise in the cause variable can influence the effect but not the other way round. So the noise in the effect dataset is always more complex than the noise in the cause dataset. .. The results suggest that the additive noise model can tease apart cause and effect correctly in up to 80 per cent of the cases (provided there are no confounding factors or selection effects).

and jmlr a more theoretical account

Based on these deliberations we propose an efficient new algorithm that is able to dis- tinguish between cause and effect for a finite sample of discrete variables.

tbc


CC-BY-NC Science Surf , accessed 19.09.2026