F: Dann lassen Sie uns über die Strukturen und ihre Probleme sprechen. Damit sind wir plötzlich sehr nah dran an der MPG, oder?
A: Was woanders gilt, sollte auch bei der MPG so sein: Wir müssen bei der Förderung des wissenschaftlichen Nachwuchses sicherstellen, dass die Wissenschaftsfreiheit auch für sie gesichert ist - nicht nur für die Führungsspitze unserer Institute. Und wir müssen in der Wissenschaft Rahmenbedingungen schaffen, die eine Spontaneität, wie ich sie meine, ermöglicht. Indem wir nicht nur Forschung belohnen, die en vogue ist, die zu möglichst vielen hochrangigen Publikationen führt.
One such proposal published in a 2015 paper in Current Biology reads: "C.M.B. would specifically like to highlight the ongoing and unwavering support of Lorna O'Brien. Lorna, will you marry me?"
Jos Barlow, a conservation scientist from Lancaster University in the U.K. and the Federal University of Lavras in Brazil, who led the team, wrote in the acknowledgement: "Some contributors declined authorship to maintain anonymity. We regret this was necessary and thank them for their important contribution."
People may be fleeing catastrophic events in their home countries. When preparing now a lecture on medical consequences of the climate crisis ( based on the 2019 Lancet Report ) I found an intriguing piece at the UNHCR website.
According to the Internal Displacement Monitoring Centre, there were 18.8 million new disaster-related internal displacements already in 2017. Displacement across borders also occurs, and may be interrelated with situations of conflict or violence. From the legal side, however, there are no “climate refugees”, as a refugee is defined as a person who has crossed an international border
owing to well-founded fear of being persecuted for reasons of race, religion, nationality, membership of a particular social group or political opinion
It took a long time from my initial grant application at Sander Stiftung in Dec 2009 (where it was rejected), to the field work within the scope of the EvA study (where the PI Loems Ziegler-Heitbrock retired).
Followed by some first analysis together with Francesc at CNAG in Barcelona the final publication now appeared – my gratulations to Gian-Andri and Ivo Gut for their hard work!
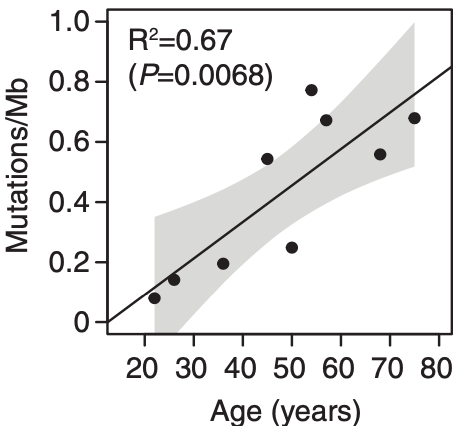
Chronic obstructive pulmonary disease (COPD) is induced by cigarette smoking and characterized by inflammation of airway tissue. Since smokers with COPD have a higher risk of developing lung cancer than those without, we hypothesized that they carry more mutations in affected tissue.
We called somatic mutations in airway brush samples from medium-coverage whole genome sequencing data from healthy never and ex-smokers (n=8), as well as from ex-smokers with variable degrees of COPD (n=4). Owing to the limited concordance of resulting calls between the applied tools we built a consensus, a strategy that was validated with high accuracy for cancer data.
However, consensus calls showed little promise of representing true positives due to low mappability of corresponding sequence reads and high overlap with positions harbouring known genetic polymorphisms. A targeted re-sequencing approach suggested that only few mutations would survive stringent verification testing and that our data did not allow the inference of any difference in the mutational load of bronchial brush samples between former smoking COPD cases and controls.
So we would have probably needed a higher genome coverage on our brush sample mix. Or should we have sequenced more single cells as discussed in the paper?
At least, we now know, that sequencing at rather low coverage rate is not a screening tool for expected cancer development. Are there less pre-malignant lesions than expected? When looking at some other papers (Cancer Genome Atlas,esophagus, and more recently colon samples, I can only confirm what Iñigo Martincorena wrote
this study emphasizes how little we know about somatic evolution within normal tissues, a fundamental process that is likely to take place to varying degrees in every tissue of every species.
Somatic mutations accumulates with age. There may be even more mutations in the aging esophagus than in sun-exposed human skin. Lee-Six estimates 43.6 mutations /year, while I still have a gut feeling that there is no gradually accumulation of mutations (until the second hit) but a clonal expansion of a single
bronchial cell, hit by a single smoke stream. With this hypothesis, smoking would not kill by accumulation of deleterious mutations, but by the never ending re-exposure until the ultimate deleterious mutation occurs.
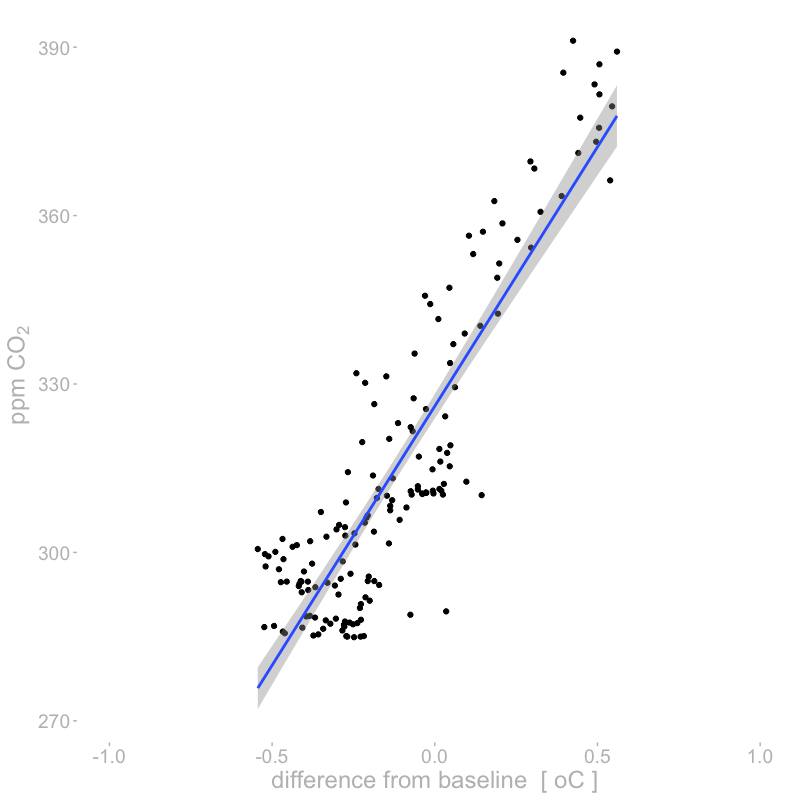
Time course of earth temperature (1850-2018) and CO2 (1850-2011)
while the correlation is higher than I expected
Correlation of earth temperature and CO2
References
1850-1957: D.M. Etheridge, L.P. Steele, R.L. Langenfelds, R.J. Francey, J.-M. Barnola and V.I. Morgan, 1996, J. Geophys. Res., 101, 4115-4128,”Natural and anthroupogenic changes in atmospheric CO2 over the last 1000 years from air in Antarctic ice and firn”.
1958-1974: Means of Scripps Institution of Oceanography Continuous Data at Mauna Loa and South Pole provided by KenMaarie (personal communication)
1975-1982: Means of NOAA/CMDL in-situ data at Mauna Loa and South Pole. (P. Tans and K.W. Thoning, ftp://ftp.cmdl.noaa.gov/ccg/co2/in-situ)
1983-2003: Global means constructed using about 70 CMDL CCGG Sampling Network station data. (P.P. Tans and T.J. Conway, ftp://ftp.cmdl.noaa.gov/ccg/co2/flask)
2004-2007: Global mean growth rates. (T. Conway, ftp://ftp.cmdl.noaa.gov/ccg/co2/trends)
Es ist nicht einfach, hier einen Überblick zu bekommen.
Jedenfalls sollte man von Qualität der Wettervorhersagen (die für die nächsten 24 Stunden von 75% auf über 90% in den letzten 20 Jahren gestiegen ist), nicht auf die Qualität der Klimavorhersagen schliessen.
Die Geschichte der Klimaforschung kann jedenfalls in vier Beiträgen lückenlos nachgelesen werden:
The reminder app survived the move from iOS 12 to 13 but not the upgrade from Sierra to Catalina ( if your syncing like me via CalDAV to your own cloud ).
Oder doch nicht, wenn man sich “chasing ice” auf Youtube ansieht?
Urs Bruderer hat diese Frage in einem wunderbaren Essay über “Die große Überforderung” thematisiert
Ich habe die Klimakatastrophe viele Jahre kaum beachtet. Und hielt das für die klügste Entscheidung.
Seit Menschen denken können, warnen sie vor ihrem Ende.
…
Ob der Atomkrieg, das Waldsterben oder das Auslaufen des Maya-Kalenders im Dezember 2012, ob im Cern produzierte schwarze Löcher, Milleniumsbug oder Vogelgrippe - im Rückblick bewies jedes Weltuntergangsszenario nur, dass wir eine Lust an der Angst vor dem Ende haben.
…
Der Weltklimarat hat inzwischen unzählige Berichte und Sonderberichte veröentlicht. Die Warnungen wurden immer genauer und bedrohlicher. Und ich wurde immer besser darin, sie zu überhören.
Einen Artikel, den man vollständig gelesen haben muss.
Last week I had the opportunity to attend a lecture by Johann Rockström explaining his most recent Nature commentary about tipping points “too risky to bet against”.
The Intergovernmental Panel on Climate Change (IPCC) introduced the idea of tipping points two decades ago. At that time, these 'large-scale discontinuities' in the climate system were considered likely only if global warming exceeded 5 °C above pre-industrial levels. Information summarized in the two most recent IPCC Special Reports (published in 2018 and in September this year) suggests that tipping points could be exceeded even between 1 and 2 °C of warming.
This is a cruel message in particular as probably already one tipping point has been passed @ the Amundsen Sea embayment of West Antarctica. There is a thick ice sheet of about 3 km which forms one of the three major ice-drainage basins of the West Antarctic Ice Sheet. And the ice is melting rapidly – with the tipping point having been passed in 1996.
The Amazon is burning right now - the world's largest rainforest. Estimates of the Amazon tipping point ranges between 20% and 40% deforestation.
Panel discussion 1st Helmholtz Sustainability Summit Max-Delbrück Zentrum Berlin. From left to right Prof. Dr. Thomas Hirth, Prof. Dr. Martin Visbeck, Prof. Dr. Otmar Wiestler, Prof. Dr. Heike Graßmann, Prof. Dr. Michael Backes, Heike Leitschuh. More talk than action.
I remember an old vitamin D book – I believe it was Feldman’s Vitamin D – that argues that if we are going down the Transsahara Route (Algier-Lagos) human skin color gets always darker towards Tamanrasset due to increased solar power- also known known as the Loomis hypothesis (Science 1967).
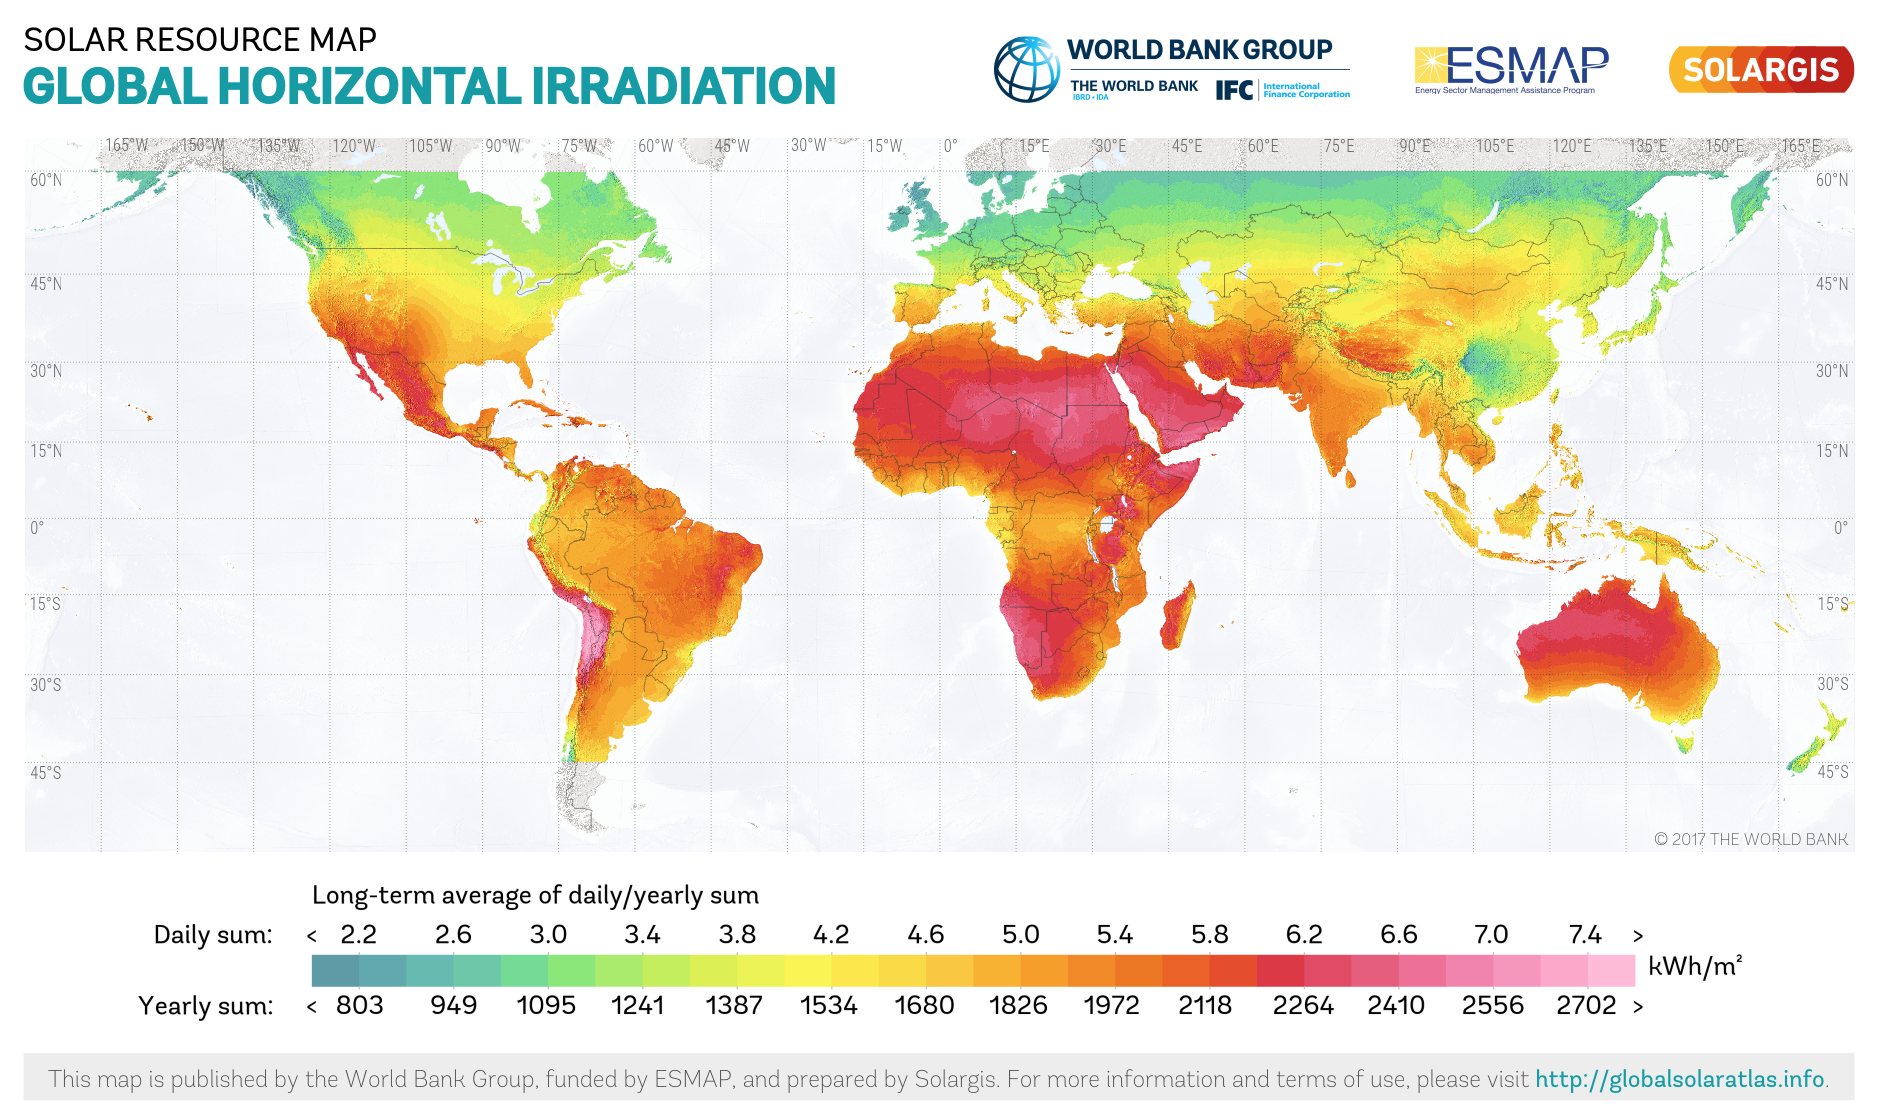
So , let’s have a look at three maps. Solar power first.
1. Solar power. Source: https://upload.wikimedia.org/wikipedia/commons/1/1e/Global_Map_of_Global_Horizontal_Radiation.png
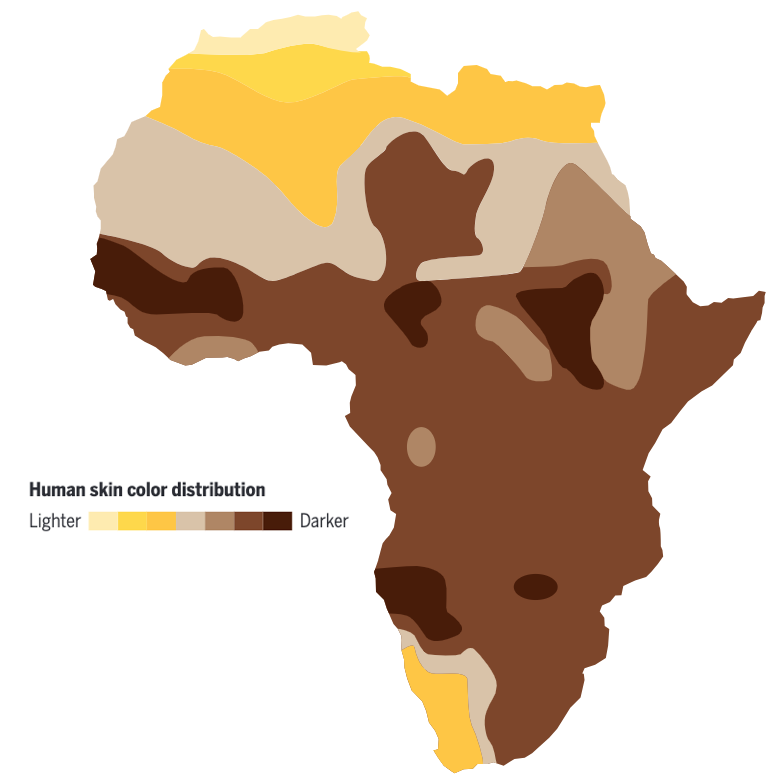
Second, skin tones – the Tamanrasset observation is correct but the overall picture does not match the Loomis hypothesis.
2. Skin tone. Source https://science.sciencemag.org/content/358/6365/867.full For full details see the original paper
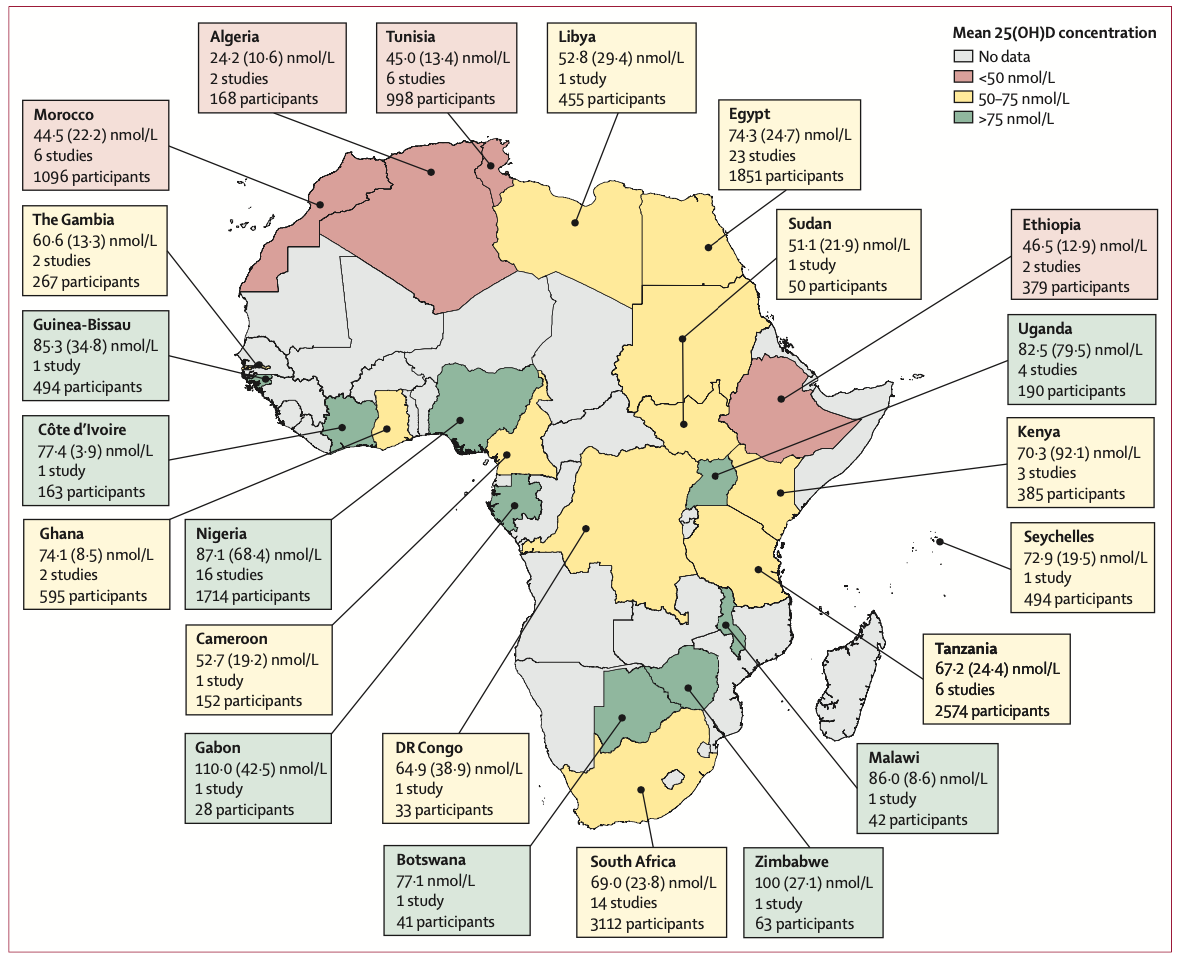
Neither does the new vitamin D map published last week in the Lancet.
3. Vitamin D map. Source: https://linkinghub.elsevier.com/retrieve/pii/S2214109X19304577 For full details see the original paper
No need to calculate any formal correlation coefficient. – maps are patchy but let me conclude that either the vitamin D data or the Loomis hypothesis is wrong.
Womöglich gedeihen Innovationen manchmal ganz im Gegenteil besonders gut, wenn ein Tier genug hat: ausreichend Zeit und Energie, um etwa mit dem Schloss einer Futterkiste herumzuspielen. Neues ausprobieren kann vor allem, wer sich nicht rund um die Uhr mit Futtersuche, Wacheschieben und Revierverteidigung aufreiben muss, sondern derartige Verpflichtungen auch mal an Artgenossen delegieren kann.
Vermutlich ist es bei den Menschen auch nicht viel anders. Wenn man sich nicht rund um die Uhr mit Futtersuche, Wacheschieben und Revierverteidigung aufreiben muss.
Here is the math: 1 µg/L D3 => 40 IU/L D3 => 2,5 nmol/L D3
The detection limit in breast milk is 0,2 nmol/L = 0,08/µg/L = 3,2 IU/L according to vid Streym who measured a median of 0.34 nmol/L 25-OH-D3 in hind milk which is approx 5,4 IU/L.
Li-Chieh Wang gives no detection limit but measures approx 5 ng/mL = 5.000 ng/L = 5 µg/L = 12,5 nmol/L D3 in breast milk equivalent to 200 IU/L, the 40fold amount to vid Streym.