Tag Archives: Population + Epidemiology

Here’s lookin’ at you, kid

In German Humphrey Bogart’s immortal expression “Here’s lookin’ at you, kid” was translated “Ich seh’ Dir in die Augen, Kleines” which translates back to “I look in your eyes, honey”. Seems that this was a spontaneous idea of Bogart on 3rd July 1942 in the Burbank Studios of Warner Brothers if we believe this website.

I am now looking in your eyes with a new study by my long-term penpal David Duffy – 3 OCA2 intron 1 SNPs (rs7495174-rs6497268-rs11855019) are sufficient to explain most human eye colors: T-G-T/T-G-T diplotype is found in 62% blue/gray, 28% green/hazel and 10% brown eyes.

In a (soon to be published) study of European population stratification we also typed 2 OCA2 SNPs but unfortunately not the same ones; I checked also the Affymetrix 500K panel but it doesn`t included these SNPs as well.

Epidemiology in wartime

What was the best paper in 2006? I am voting for a Lancet paper by Gilbert Burnham, Riyadh Lafta, Shannon Doocy and Les Roberts. Between May and July, 2006, they did a national cross-sectional cluster sample survey of mortality in Iraq. Data from 1849 households was gathered, 1474 births and 629 deaths were reported. As of July, 2006, there have been 654 965 excess Iraqi deaths occured as a consequence of the war.
If you can’t imagine what it means to work in war regions you may read the biography of Robert Capa (1913 –1954) who worked as a photographer in the many wars, and died in the First Indochina War. He did wonderful photos together with his girl-friend Gerda Taro, one of the first woman photographers who died by a tank accident already in the Spanish civil war at the age of 26. I will pay for the flowers if you visit her grave at Père Lachaise in Paris.

p1000279-1.JPG p1000280-1.JPG

Addendum

As expected, the study raised criticism: scienceblog:doi:10.1126/science.316.5823.355a

All roads to NLM

This is not just an addendum to my previous post free-for-all or to number-cruncher: the 12 Dec NIH press release links to a new and exciting database

NIH Launches dbGaP, a Database of Genome Wide Association Studies
The National Library of Medicine (NLM), part of the National Institutes of Health (NIH), announces the introduction of dbGaP, a new database designed to archive and distribute data from genome wide association (GWA) studies. GWA studies explore the association between specific genes (genotype information) and observable traits, such as blood pressure and weight, or the presence or absence of a disease or condition (phenotype information).

Addendum

29-5-07 dbGaP suffers from some broken links but content improves!

dbgap.png

For the first time two human genomes compared

Another “first discovery” in this nature genetics preprint although the analysis could have already been done some years earlier. The CNV specialists from Toronto now compare the Human Genome Project sequence with the Celera sequence – the gap between the two compilations was obviously bigger than the intra-sequence gaps. Of course both sequences are still mosaics from several individuals but the analysis nicely exemplifies how difficult it will be to compare the genome of two different human beings.
The authors employ a whole battery of alignment tools BLAT, MEGABLAST, GCA and A2Amapper. Of course results depend on the strategy, definition and implementation. As show by FISH analysis most of the discrepancies are true and can be classified into a few categories – insertions or deletions if seen from the second genome (has somebody ever thought about a minimal human genome?), mismatches and inversions. We are getting here a preview of the diagnostic workup in a patient in 2026. This blog contains forward looking statements while the responsibility rests solely with the reader. Yea, yea.

An utter refutation

I am slow in commenting on a paper that has already been published earlier this year – Joe Terwillingers vivid refutation of the fundamental theorem of the hapmap proponents that

if a marker is in tight LD with a polymorphism that directly impacts disease risk, as measured by the metric r^2, then one would be able to detect an association between the marker and disease with sample size that was increased by a factor of 1/r^2 over that needed to detect the effect of the functional variant directly

I cannot comment on the statistical proof but fear from my recent experience with Crohn and asthma tags that he may be right with his assumption: Even marker in high LD with the functional variant may not show any association at all. These may be bad news for all those currently running large screening programs with hapmap based variants believing that P(A|BC)=P(A|Bc)=P(A|B), yea, yea.

Addendum

Tag SNPs also do not work with CNVs

Who will survive?

When looking at gene variants in a population we may forget that even having a perfect sampling scheme this will not be an unbiased view of the human genome. Earlier studies suggested that up to 75% of conceptions are lost during early development; a further indicator of an biased view are unexplained cases of departure from Hardy-Weinberg equilibrium.
Selective survival during early pregnancy is still a terra incognita and except of studies in the Hutterites I am not aware of any (modern) study that looked at selective survival.
A study of Grant Montgomery now shows fresh data on genomewide allele sharing in 1,592 DZ twins from Australia and 336 DZ pairs from the Netherlands.
It is somewhat disappointing that there is no excess allele sharing in the HLA region nor somewhere else in the genome. Maybe further studies can do that a high resolution than with just 359 microsatellite marker?

Escaping from a swamp

The November AJHG has an excellent re-analysis of the dysbindin-schizophrenia association using new methodology that surpasses all previous meta-analysis techniques. As the single SNP association results from the previous 6 studies cannot be directly compared, they construct a European super-hap map from all tag SNPs in that region, place them in a phylogenetic tree before finally mapping all single associations on these haplotypes. Their Fig.1B show the main results; as the circles in Fig.1B are somewhat confusing, I have withdrawn their results – adding the haplotype frequencies and ordering the studies by year of publication.

pc010002-2.JPG

We may think of a triple-blind study – neither patients, nor PIs, nor we did know anything before. The results are alarming. I do not understand how the Kirov set could have included all haplotypes and why the Schwab/Williams set is in opposition to the Straub/Bogaert/Funke set.
What could have gone wrong? The authors of the current re-analysis believe that population differences are an unlikely reason for the inconsistency as the allele frequencies match between studies. Good news that genotyping errors may be largely excluded.
Unfortunately the authors remain vague why there is no common causal variant. Have there been different sampling schemes, different diagnostic thresholds, different environmental exposures in the previous studies? Is dysbindin at all a schizophrenia gene, or only under a certain genetic background? It seems possible that studies of one branch are false positives. Or is the haplotype reconstruction in the re-analysis erroneous for whatever reasons?
Von Münchhausen is well know for escaping from a swamp by pulling himself up by his own hair. I would like I could do that too.

Number cruncher

In a recent blog I described high resolution SNP datasets that are available on the net. To work with these datasets you will probably need to upgrade your hardware and software. For data handling many people stick nowadays to commercial SQL databases that have plugins for PD software.
My recommendation is to save that money and store the data in a special format that may be more useful for these large dataset; details are in a technical report that I will upload later this day. In the meantime you can already check some software tools to work with these large datasets. This is what I know so far

  • David Duffy has recompiled his sibpair program |link
  • Geron(R) has something under development |link
  • Jochen Hampe and colleagues offer Genomizer |link
  • Franz Rüschendorf developed Alohomora |link
  • I renember about SNPGWA, a development at Wake Forest University |no link yet
  • there will be a R-Bioconductor package by Rob Scharpf |no link yet
  • R library GenABEL by Yurii Aulchenko |link
  • R library SNPassoc by Juan González |link

Addendum

A technical report how to work with large SNP dataset is now also available at my paper section. Alternatives to what I am suggesting in this paper, have been set out by an anonmyous reviewer

For R users, if SQLite limits are reached, hdf5 (http://hdf.ncsa.uiuc.edu/HDF5/) may be one way forward for really huge table structures since there is an R interface already available. PostgreSQL column limit depends on data type with a maximum of 1600 for simple types. MySQL with the BerkeleyDB backend may be like SQLite with no obvious column count limit. Metakit is not mentioned – it is column oriented and probably also has “unlimited” columns as long as each database is < 1GB or so.

Better than the Delphi oracle

A new paper shows a nice workflow how to do an in vitro prediction which drug will suppress a certain tumor. The authors are simply linking the phenotype of the cell line “50% inhibitory concentration by drug X” with its expression signature. The good news are that doing both in one vial (phenotyping and expression analysis) is leading to excellent results.

genomicsignature.png

Is there any trick to do this also system-wide e.g. for the metabolism of a substance and its signalling pathway? Pharmacogenetics would greatly benefit from such an approach, nay, nay.

Helicopter epidemiology

Already at the very early beginning of my career I have been told about the dangers of “armchair” epidemiology – researchers only managing studies. There seems to be even another extreme, called “helicopter epidemiology” as pinpointed in the Lancet recently

…fly into a remote location containing “interesting individuals”, collect descriptive data and biological specimens, fly out, process, and publish the information elsewhere…

Nice to know

-moblog- There are many things “nice to know” but only a few “need to know”. Molecular epidemiologists having access to large datasets sometimes forget what most people on earth “want to know” – how to prevent and cure human disease.

Nothing makes sense except in the light of a hypothesis

Looking again at human variation it seems that my recent estimate of 99,9% sequence identity is wrong as shown in an nature editorial yesterday and of course the new paper with the first copy number map of the human genome

3,080 million ‘letters’ of DNA in the human genome
22,205 genes, by one recent estimate
10 million single-letter changes (SNPs) —
that’s only 0.3% of the genome
1,447 copy-number variants (CNV),
covering a surprisingly large 12% of the genome
About 99.5% similarity between two random people’s DNA

I am organizing my literature in folders where the CNV section is still very thin but labelled as high priority – this seems to be adequate as the new study shows that the CNV emcompass hundreds of genes and functional elements.

Notably, the CNVRs encompassed more nucleotide content per genome than SNPs, underscoring the importance of CNV in genetic diversity and evolution

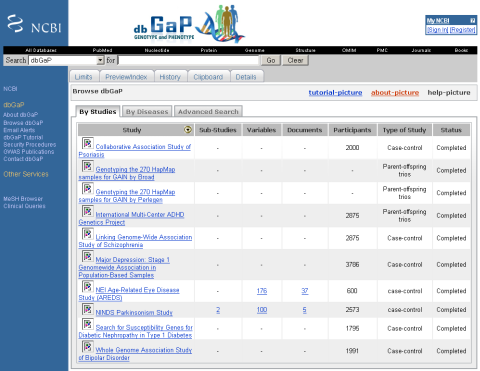
The Wellcome Trust has a nice website about copy number variants. If you want to read more, you will find information about the methods (array-based comparative genome hybridisation, cytogenetics, population genetics, comparative genomics and bioinformatics) as well as the questions that drive CNV research.
Again it seems that disease genetics is not only about stupid nucleotide polymorphisms (SNP), it is a whole bunch of chromosome aberration, segmental duplication, insertions and deletions – there is a good chance that these new data will improve our complex disease mapping efforts. I am quite confident that CNVs are not randomly distributed in the genome

CNV genes encode disproportionately large numbers of secreted, olfactory, and immunity proteins, although they contain fewer than expected genes associated with Mendelian disease […] Natural selection appears to have acted discriminately among human CNV genes. The significant overabundance, within human CNVs, of genes associated with olfaction, immunity, protein secretion, and elevated coding sequence divergence, indicates that a subset may have been retained in the human population due to the adaptive benefit of increased gene dosage.

There is a good chance of retrieving even posthoc CNV information from SNP arrays by taking into account relative signal intensity. Yea, yea.

Addendum

The mouse data are now also online.

Hap world map?

A new study of 12 Mb DNA sequence in 927 individuals representing 52 populations now finds good portability of of tag SNPs between the 4 hapmap groups and any of the 52 populations (except some African populations like the Mandenka, Bantu, Yoruba, Biaka Pygmy, Mbuti Pygmy and San). The paper has some exceptional well done graphics – and I am quite happy that the resolution of European nations leaves some gaps for our forthcoming ECRHS papers (a poster had already been on display at the 3rd Annual International HapMap Project in Cambridge, Massachusetts).

“Die Botschaft hör’ ich wohl, allein mir fehlt der Glaube” (Goethe, “I hear the message well…”). The usefulness of tagSNPs in disease association studies still remains to be shown (I still renember comments like cr.. map). At present I neither believe in rare variants nor in common common variants but a permanent reshuffling of rare, frequent and highly abundant variants. Yea, yea.

The journey is the reward

The analysis of a large dataset can be done in many different ways. At least in my experience documentation is getting confusing after many weeks of work – what has been done at which time? Can I reproduce my earlier findings? Where are the latest figures? What remains to be done? …

This is an ever increasing problem. Some information is documented in lab books, other in clinical journals, or even sitting on a server database where it may change over time. I have therefore described my own documentation procedure in a PDF paper that is online at this site.

With a quick view at the figure you will see that I am (mis-)using spreadsheets for documentation Please note (1) the drop down arrows at date and task that can be used for selecting lines even of long lists and (2) that tabs can used for fast switching between results (3) one tab contains all analysis scripts (4) and one tab all links.

spread.png

Best of two worlds

Finally, linkage and association data can be used together after downloading new software using genotype inference.

It reduces the number of genotyping reactions and increases the power of genome-wide association studies. Our method combines sparse marker data from a linkage scan and high-resolution SNP genotypes for several individuals to infer genotypes for related individuals.

Sure, we