“Silver bullet” ist eigentlich übersetzt Wunderwaffe oder Königsweg. Ob die Corona-Epidemie zum Wegbereiter einer Klimawende wird? Mehre Twitter Beiträge heute verlinken auf einen medium Artikel von Brad Zarnett ” Das Problem ist nicht Plastik, nicht die Abholzung, nicht das Auslöschen einer Spezies oder der Biodiversität, es ist die Art und Weise wie wir unser Zusammenleben gestalten, wie wir Geschäfte machen und wie wir den Fortschritt messen”
Something changed recently when I saw a map comparing the air over China before and after the country went into lockdown in an attempt to contain the COVID-19 Coronavirus. Slowly over the course of a week, I began to see the issue of climate change in a whole new light. … The path towards a stable climate will need to run through some kind of economic collapse. It will have nothing to do with a more sustainable business model or more progressive government action — both of those approaches have failed. Let’s face it — people just don’t feel the urgency to change how they live their lives and government is too weak and/or corrupt to lead the way.
Am 16.12. war die Weihnachtsvorlesung des Ökonomen Hans-Werner Sinn (“das grüne Paradoxon”) in der Aula der LMU. Sinn stellte dort seine Thesen zur Wiederaufnahme der Kernernergie vor – gegen den Ausbau CO2 freier Techniken der Energiegewinnung durch Solarenergie und “Windflügel” und Energiespeicherung durch Pumpspeicherkraftwerke oder H2. “Wir bauen doch auch neue Passagierschiffe obwohl die Titanic unterging”.
Dabei liegt der Beitrag von Kernkraftwerken zur Endenergieversorgung in Deutschland bei nur 11% mit sinkender Tendenz und ist auch politisch keine Alternative durch die Risiken bei Betrieb und Endlagerung.
Allein schon semantisch, ist das grüne Paradoxon längst ein Misnomer. Die Energie- und Verkehrswende ist kein grünes Thema mehr. Und paradox (“der gewöhnlichen Meinung zuwiderlaufend”) ist es auch nicht, dass die absehbar verbesserte Umweltpolitik die Ressourcenförderung und -verbrauch übergangsweise beschleunigen kann. Ein kurzfristiger Anstieg der Förderung kann natürlich vorkommen, ist aber dann wohl mehr ein kurzfristiger Rebound als ein wirkliches Paradox, denn wenn die Nachfrage langfristig überall sinkt, dann bleibt das Öl im Boden und wird nicht mehr in Geld in der Schweiz umgewandelt. Bei verminderter Nachfrage stehen die Förderanlagen nutzlos herum (und verfallen) oder müssen mit Verlust instand gehalten werden. Sein angenommener Verschiebebahnhof “dann nehmen die Amerikaner oder Chinesesen das Öl” ist zudem rassistisch, denn das Argument unterstellt allen nicht EU Staaten sowenig Intelligenz, dass sie die Klimakrise nicht mitbekommen würden.
In zwei geschlagenen Stunden habe ich keinen einzigen empirischen Beweis für Sinns These gesehen, dafür aber immer wieder populistische Stimmungsmache, Apelle an den “gesunden Menschenverstand” und um Anerkennung bemühte Überzeugungsversuche, Zitat “das ist kein Modell sondern einfache Rechnung”, “hartes Faktum, das kann jeder rechnen”, “da ist keine Theorie dabei”. Damit brauchen wir uns dann auch nicht wundern, dass heute morgen die ewig gestrigen Ideen wieder in der Zeitung stehen.
https://www.spiegel.de/plus/deutschland-war-der-atomausstieg-ein-fehler-a-38ddbbc7-93c6-43aa-982b-2ea46ada42ed oder https://www.spiegel.de/plus/harvard-professor-ueber-risiko-mythen-wir-brauchen-mehr-atomkraft-a-00000000-0002-0001-0000-000167507159
Gab es irgend etwas Positives in dem Vortrag? Ja, an wenigen Stellen: Prämienzahlungen für den Erhalt der Wälder wären in der Tat eine gute Idee, ebenso die Besteuerung des Kapitalmarktes in der Schweiz und eine “Koalition der willigen” Nationen, die beim Klimaschutz vorangehen.
Schade, dass von den einstigen Idealen so wenig übrig geblieben ist…
Einwand: Was machen schon die 400 ppm oder 0,04% CO2 in der Atmosphäre, die doch zum Großteil (78,1 %) aus Stickstoff, etwas Sauerstoff (20,9%) und ein bisschen Argon (0,93 %) besteht?
Schon Paracelsus wusste, dass die Dosis das Gift ausmacht (“”sola dosis facit venerum”). Die LD50, also die Dosis, die bei der Hälfte der Menschen tödlich wirkt, liegt bei verschlucktem Botulinumtoxin ungefähr bei 10 Nanogramm. Auf 80 kg Körpergewicht oder 80 000 Gramm oder 80 000 000 Miligramm oder 80 000 000 000 Mikrogramm oder 80 000 000 000 000 Nanogramm gerechnet, sind die 10 Nanogramm nicht sonderlich viel ( 1,25 * 10^-13 ). Aber tödlich, wenn man diese Menge verschluckt hat!
Schlecht aber auch, wenn das CO2 nun an der Decke klebt, die 400 ppm sind die 320 000 fache Konzentration des Botulinumtoxins.
Einwand: Was macht schon 1 Grad mehr im Jahr aus, wo die Temperatur doch bei uns im Jahr zwischen -20 und +35 Grad schwankt?
Wenn ich die rechte Hand auf eine heisse Herdplatte lege und die linke in Eiswasser halte, ist das im Mittel auch nur lauwarm, oder?
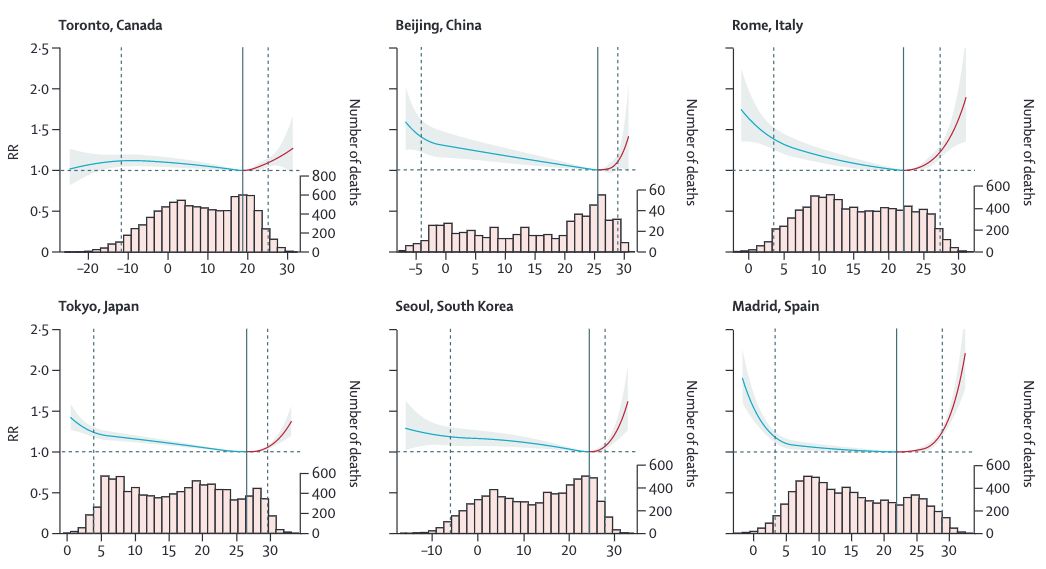
Über Jahre und geographische Regionen gemittelte Werte sind nicht geeignet, um Risiken durch Extremwerte zu erfassen. Die Umgebungstemperatur beeinflusst dabei die Mortalität, hier ein Ausschnitt aus einer Grafik im Lancet.
Ausschnitt aus FIG 1 https://www.thelancet.com/journals/lancet/article/PIIS0140-6736(14)62114-0/fulltext
Es gibt in den Grafiken oben (noch) wenige Beobachtungen über 30 Grad, aber hier steigt das Risiko exponentiell an. Was Hitze im menschlichen Organismus anrichtet ist bekannt: Kreislaufstörungen bis hin zu Hitzschlag und Tod.
EP Fischer beschreibt den “gemeinen Menschenverstand” – wie er bei Immanuel Kant im 18. Jahrhundert noch hieß – mir der Schicht von Vorurteilen, die sich in den Köpfen der Menschen ablagern, bevor sie 18 Jahre alt werden. “Es ist das Denken, wie es sich entwickelt und herausbildet, wenn ihm nichts auffällt und nichts dazwischen kommt. Der gesunde Menschenverstand ist das biologische Brett vor dem Kopf, das den Durchblick zur wissenschaftlichen Einsicht verhindert.” Stellen wir also Pro und Contra gegenüber.
Aber gerade in der Wissenschaft, wo es gelegentlich an ihm mangelt und er wenig geachtet ist, wäre es zu begrüssen, wenn der Common Sense eine grössere Rolle spielte. Wissenschafter sind in der Lage, einen detaillierten Gedankengang zu entwickeln, der zu einem unplausiblen und der Vernunft widerstrebenden Schluss führt. Und oft sind andere Wissenschafter bereit, diesen unplausiblen Schluss zu akzeptieren, weil sie sich von den Details der Argumentation einwickeln lassen.
In den Worten des französischen Philosophen der Wissenschaft Gaston Bachelard: “Eine wissenschaftliche Erfahrung ist eine Erfahrung, die der gewohnten Erfahrung widerspricht.” …
Denn zu unseren gewohnten Erfahrungen gehart es zum Beispiel, daß ein Stein schneller zu Boden fällt als ein Blatt. Vor langer Zeit – gemeint ist die Antike – wurde daraus noch der (scheinbar logische) Schluß gezogen, daR allgemein schwere Körper schneller fallen als leichte.
People may be fleeing catastrophic events in their home countries. When preparing now a lecture on medical consequences of the climate crisis ( based on the 2019 Lancet Report ) I found an intriguing piece at the UNHCR website.
According to the Internal Displacement Monitoring Centre, there were 18.8 million new disaster-related internal displacements already in 2017. Displacement across borders also occurs, and may be interrelated with situations of conflict or violence. From the legal side, however, there are no “climate refugees”, as a refugee is defined as a person who has crossed an international border
owing to well-founded fear of being persecuted for reasons of race, religion, nationality, membership of a particular social group or political opinion
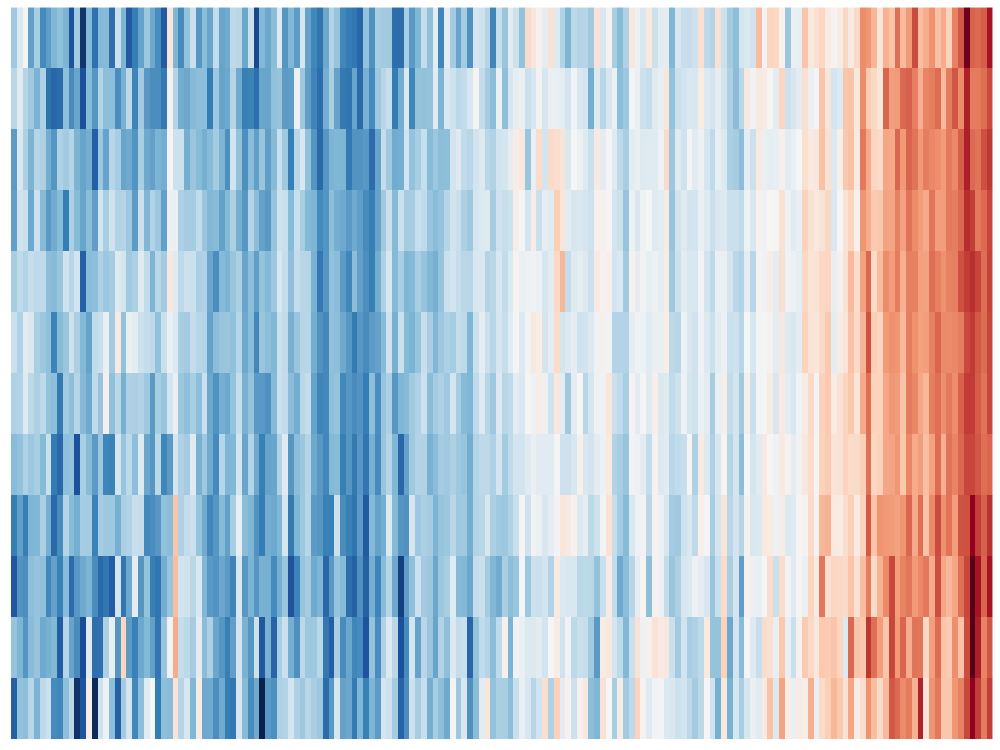
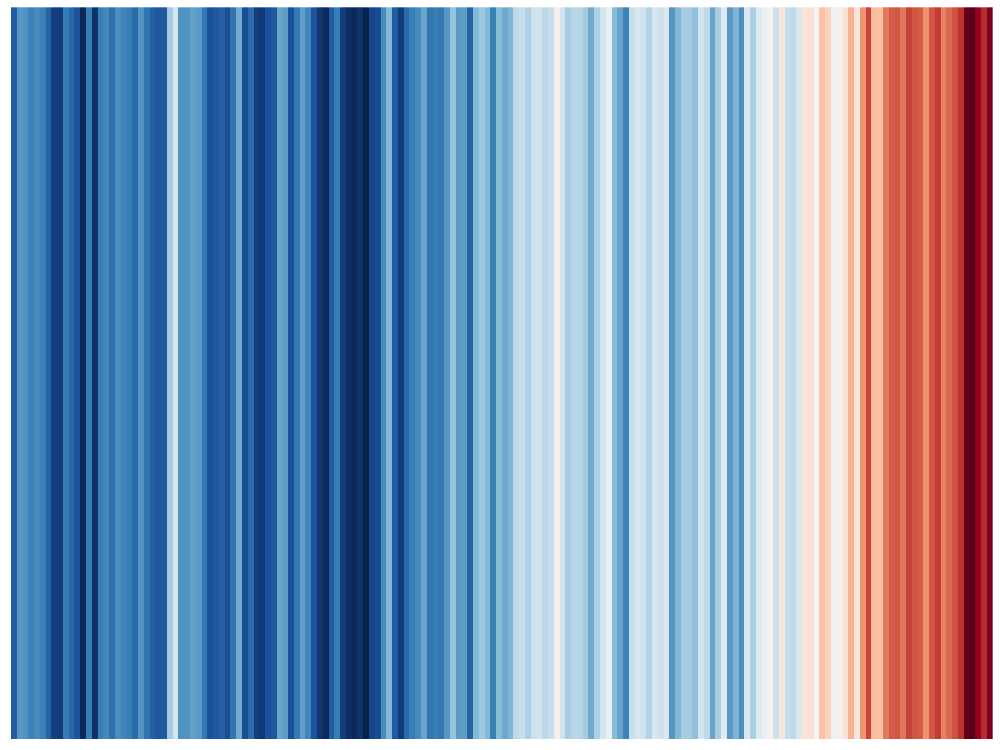
Time course of earth temperature (1850-2018) and CO2 (1850-2011)
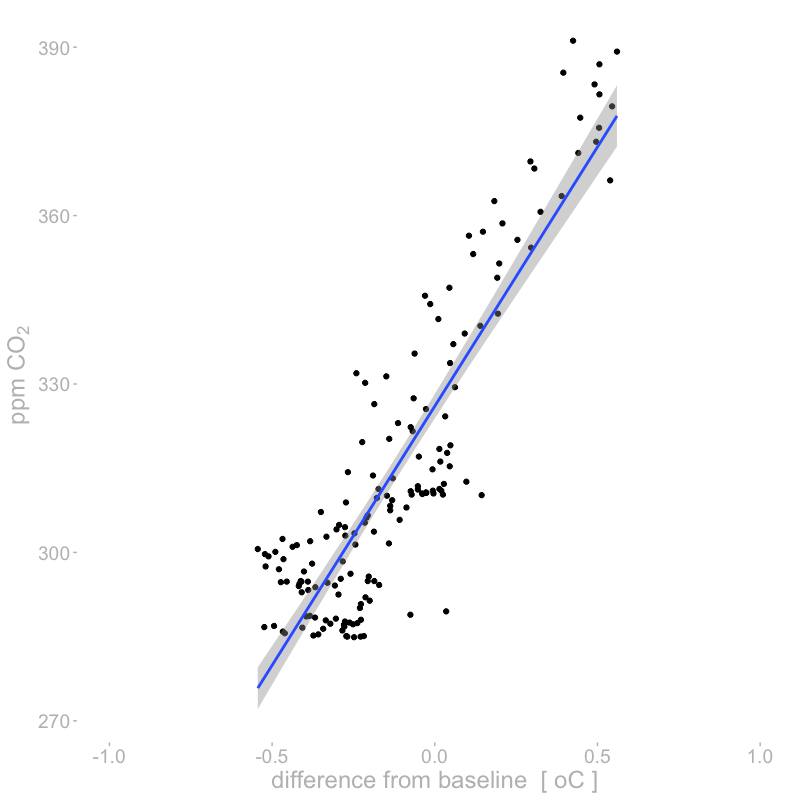
while the correlation is higher than I expected
Correlation of earth temperature and CO2
References
1850-1957: D.M. Etheridge, L.P. Steele, R.L. Langenfelds, R.J. Francey, J.-M. Barnola and V.I. Morgan, 1996, J. Geophys. Res., 101, 4115-4128,”Natural and anthroupogenic changes in atmospheric CO2 over the last 1000 years from air in Antarctic ice and firn”.
1958-1974: Means of Scripps Institution of Oceanography Continuous Data at Mauna Loa and South Pole provided by KenMaarie (personal communication)
1975-1982: Means of NOAA/CMDL in-situ data at Mauna Loa and South Pole. (P. Tans and K.W. Thoning, ftp://ftp.cmdl.noaa.gov/ccg/co2/in-situ)
1983-2003: Global means constructed using about 70 CMDL CCGG Sampling Network station data. (P.P. Tans and T.J. Conway, ftp://ftp.cmdl.noaa.gov/ccg/co2/flask)
2004-2007: Global mean growth rates. (T. Conway, ftp://ftp.cmdl.noaa.gov/ccg/co2/trends)
Es ist nicht einfach, hier einen Überblick zu bekommen.
Jedenfalls sollte man von Qualität der Wettervorhersagen (die für die nächsten 24 Stunden von 75% auf über 90% in den letzten 20 Jahren gestiegen ist), nicht auf die Qualität der Klimavorhersagen schliessen.
Die Geschichte der Klimaforschung kann jedenfalls in vier Beiträgen lückenlos nachgelesen werden:
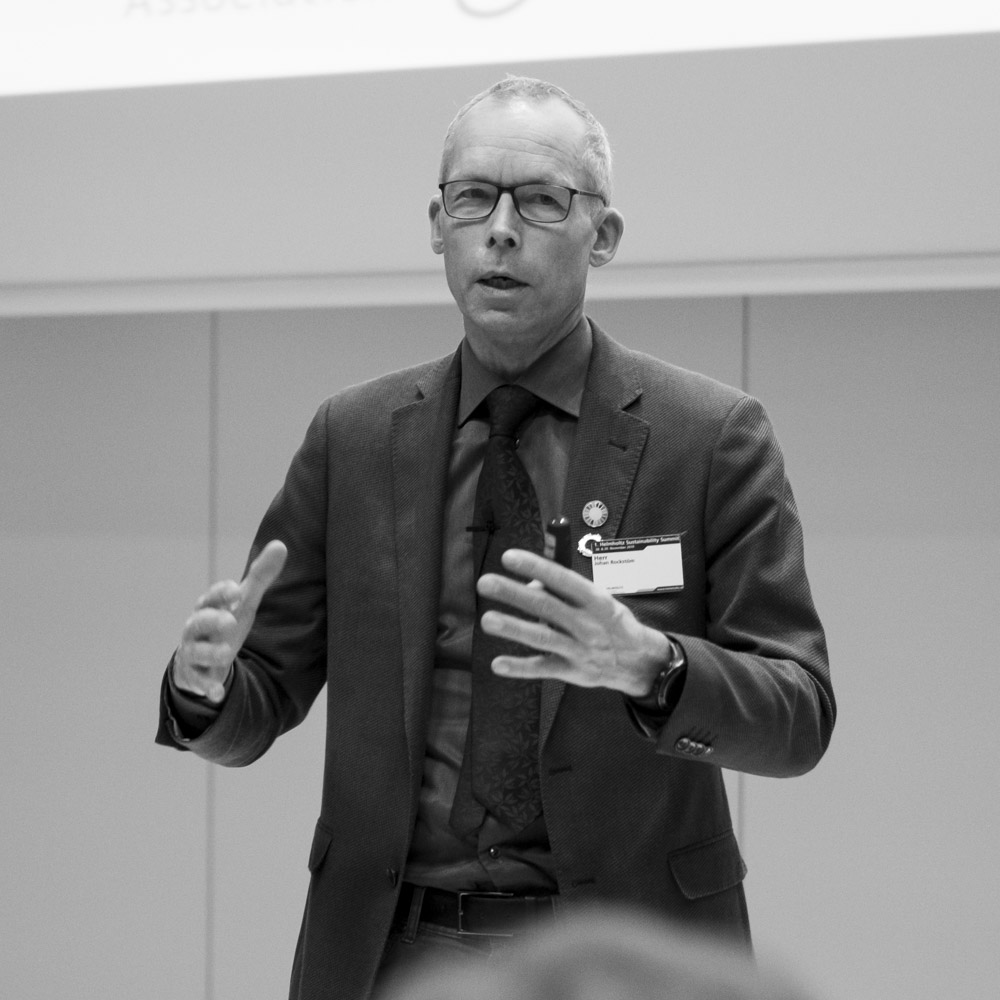
Last week I had the opportunity to attend a lecture by Johann Rockström explaining his most recent Nature commentary about tipping points “too risky to bet against”.
The Intergovernmental Panel on Climate Change (IPCC) introduced the idea of tipping points two decades ago. At that time, these ‘large-scale discontinuities’ in the climate system were considered likely only if global warming exceeded 5 °C above pre-industrial levels. Information summarized in the two most recent IPCC Special Reports (published in 2018 and in September this year) suggests that tipping points could be exceeded even between 1 and 2 °C of warming.
This is a cruel message in particular as probably already one tipping point has been passed @ the Amundsen Sea embayment of West Antarctica. There is a thick ice sheet of about 3 km which forms one of the three major ice-drainage basins of the West Antarctic Ice Sheet. And the ice is melting rapidly – with the tipping point having been passed in 1996.
The Amazon is burning right now — the world’s largest rainforest. Estimates of the Amazon tipping point ranges between 20% and 40% deforestation.
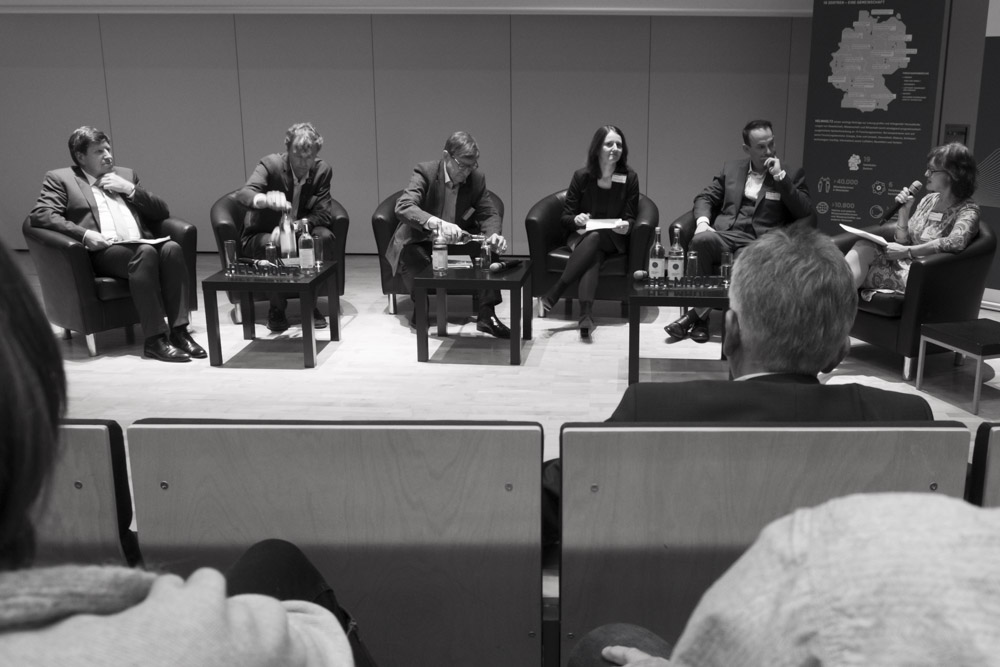
Panel discussion 1st Helmholtz Sustainability Summit Max-Delbrück Zentrum Berlin. From left to right Prof. Dr. Thomas Hirth, Prof. Dr. Martin Visbeck, Prof. Dr. Otmar Wiestler, Prof. Dr. Heike Graßmann, Prof. Dr. Michael Backes, Heike Leitschuh. More talk than action.
Air pollution and climate change are potential drivers for the increasing burden of allergic diseases. The molecular mechanisms by which air pollutants and climate parameters may influence allergic diseases, however, are complex and elusive.
There is no causal effect of allergens on human allergy, as allergens have been always abundant even without allergy. Nevertheless allergens are drivers aggravating symptoms in allergy-prone patients by basically four factors
Stability effects; influencing the accumulation and degradation of allergenic proteins, the duration of exposure times to cellular receptors, and the process of antigen presentation via major histocompatibility complex (MHC) class II
Epitope effects, i.e., generation of new epitopes or modification of existing epitopes, changing the binding properties of antibodies and receptors, by direct chemical modification or as a result of conformational changes
Adjuvant effects, i.e., generation of new adjuvant functions or modification of existing adjuvant functions such as lipid-binding capacities due to modified ligand binding sites
Agglomeration effects, i.e., multiplication or shielding of epitopes or adjuvant functions by cross-linking (oligomerization) of allergenic proteins, which may enhance the cross-linking
Hier eine Reihe von Link Tipps (eine Zusammenfassung aus der Scientists for Future Mailing Liste mit eigenen Ergänzungen).
Fakten zählen leider hier wenig, dennoch die Sache ist nicht ganz hoffnungslos, wenn man sich die Quellen ansieht, mehrfach Rollenspiel durchgeht, am besten einen Knopf im Ohr hat mit Supportern im Publikum.
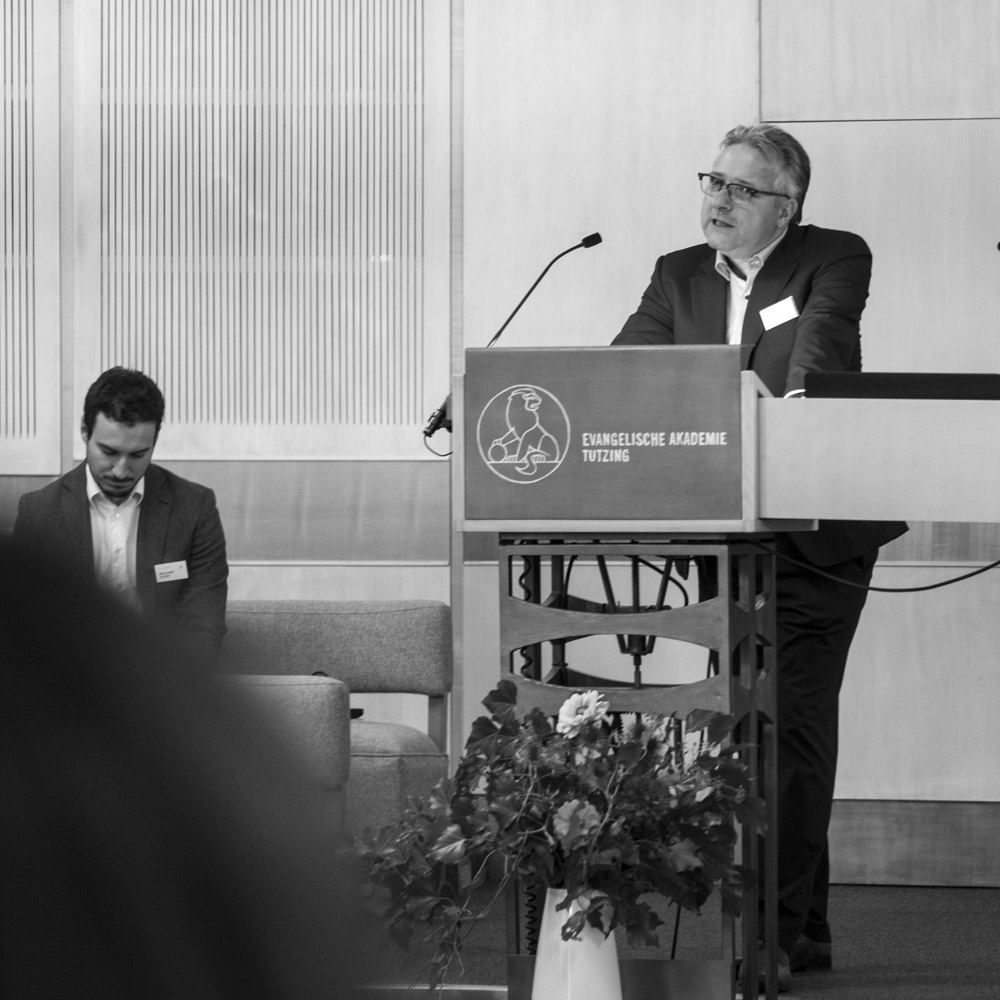
Hier ist mein Mitschrieb der Tagung in Tutzing vom 3. bis 4.11. 2019.
Die Tagung wurde gemeinsam von acatech, der deutschen Akademie der Technikwissenschaften, und TTN Ethik interdisziplinär veranstaltet. In der Begrüßung durch Stephan Schleissing (TTN) und Benjamin Zilker (acatech) wurden generelle Aspekte der Mobilität thematisiert.
Stephan Schleissing, TTN München
Von Rothe (“feste Überzeugung, daß dem Reiche Christi die Er- findung der Dampfwagen und Schienenbahnen eine weit bedeutendere positive Förderung geleistet hat als die Ausklügelung der Dogmen von Nicäa und Chalcedon”) bis zu Schwarke “Transzendenz und Technik“. Oder vom Porschemuseum mit der Himmelsleiter aka Rolltreppe bis zu dem Mooncascade Blog in dem sich zwei älteren Herren über Mobilität unterhalten.