I am currently working on a lecture how I make up my mind whenever approaching a new scientific field. Of course we get the first orientation by proven experts, by proven journals and textbooks, then we collect randomly additional material just to increase confidence.
But what happens if there is some deep fake science? A new Forbes article highlights now deep fakes, how they are going to wreak havoc on society and “we are not prepared”
While impressive, today's deepfake technology is still not quite to parity with authentic video footage-by looking closely, it is typically possible to tell that a video is a deepfake. But the technology is improving at a breathtaking pace. Experts predict that deepfakes will be indistinguishable from real images before long. "In January 2019, deep fakes were buggy and flickery," said Hany Farid, a UC Berkeley professor and deepfake expert. "Nine months later, I've never seen anything like how fast they're going. This is the tip of the iceberg."
It means that also empirical science can be manipulated as well which will be even hard to detect.
Der Begriff ist nicht neu, er wurde wohl 2019 von der Zeitschrift Atlantic erstmals in das allgemeine Bewusstsein gerückt für Forschung die direkt – ohne Ausschreibung, Wettbewerb oder Review – finanziert wird. Damals war es das MIT Media Lab, das “Spenden” von Jeffrey Epstein angenommen hat. Das muss nicht per se fragwürdig sein, hinterlässt aber doch ein ungutes Gefühl, warum gibt jemand sein Geld für Forschung aus?
Das Ganze ist natürlich ein Witz, wenn nun die Unikinderklinik Freiburg schon beklagt, dass sie nicht mehr genügend Patienten für ihre Studie findet. Und wo sollen mit aktuell 54 Neuerkrankungen in Niedersachsen die 1000 Fälle für eine Biobank herkommen? Wo sich doch längst vor Monaten ein internationales Konsortium zu der Frage gebildet hat und es nun wirklich nicht die primäre Frage ist, ob eine Genvariante das Risiko um das 1.1 fache erhöht. Mit dem nächsten Virus ist sowieso wieder alles anders.
Und sollten die Studien nicht helfen, die Containment Massnahmen zu steuern? Ausser der Gangelt Studie kenne ich keine einzige offizielle Zahl obwohl vor genau 4 Monaten der erste Fall in München beschrieben wurde. Nach den letzten Presseberichten werden die Ergebnisse der sugar daddy Studien hinter verschlossenen Türen dafür hergenommen um die lokale Politik zu rechtfertigen, ohne dass sie irgendjemand überprüfen kann. Vielleicht ist das auch besser so, denn wir wären wahrscheinlich von der Qualität enttäuscht, da kann ich mich nur Antes in der Lagebeurteilung vom 25.5. anschliessen
Ja, es gibt ein klareres Bild von der Unklarheit. Es gibt leider extreme regionale Unterschiede. Das war die Hauptkritik an der Heinsberg Studie mit ihren 14 oder 15 Prozent Dunkelziffer. Wenn ich in einen Hotspot fahre, bilde ich natürlich das ab, was vor Ort passiert ist. Es ist aber ohne jede Aussagekraft für das ganze Land … Die verschiedenen Massnahmen sind so miteinander vermengt, dass man das nicht differenzieren kann. Wir gehen leider mit allen Fehlern der Welt zurück in die Öffnung. Es ist ein Abschied von der Wissenschaft, den wir gerade sehen. … Wir haben weltweit etwa 1100 sichtbare Studien zum Thema Corona. In Deutschland scharren auch alle mit den Hufen … um Studien durchzuführen. Leider aber gibt es keine Führungsstruktur, die diese Anstrengungen koordiniert. Meine größten Vorwürfe gehen in dieser Hinsicht an das Bundesforschungsministerium, von dem man fast nichts hört. Wir bräuchten für Deutschland einen Masterplan von Fragen. Dann müsste man diese Aufgaben verteilen und die Ergebnisse zusammenfassen, damit diese Entscheidungen dienen können. Dafür muss sich Wissenschaft allerdings koordinieren lassen.
When most of a population is immune to an infectious disease either by natural infection or by vaccination, this provides indirect protection — or herd immunity — to those who are not immune to the disease.
A positive antibody response does not necessarily mean that there is immunity but nevertheless it may give a first indication how many individuals may have had contact with a virus. Be aware of several infodemic websites on seroprevalence. Also note that most information is distributed by news agencies, press offices and preprints only bypassing usual standards in science. Unfortunately also most tests have not been properly standardized.
1. Die kritische Grenze an Corona Viren, mit der man sich infizieren kann, liegt zwischen 100 und 1.000 Viren.
2. Mit normaler Nasenatmung gibt eine infizierte Person 20 Viren pro Minute durch die normale Nasenatmung ab. Nach 30-60 Minuten in einem schlecht belüftetem Raum ist genügend Aerosolnebel im Raum, um andere zu infizieren.
3. Sprechen produziert das 10fache, ca 200 Viren pro Minute, hier wird es also schon ab 5 Minuten kritisch.
4. Lautes Sprechen und Singen verteilt Aerosol weiter als 2 Meter und kann bis zu 2.000 Viren pro Minute erreichen. Hier ist die kritische Grenze also schon nach 30-60 Sekunden erreicht.
5. Beim einmaligen Husten können bis zu 200 Millionen Viren herausgeblasen werden, was für eine Infektion reicht.
6. Singen ist besonders ungünstig, da bei Mundatmung das Virus tief in die Lunge transportiert wird. In der Nase gibt es zwar die meisten Andockstellen für den Virus, deshalb verlaufen die meisten Infektionen harmlos, aber leider auch tief in den Alveolen / Lungenbläschen.
7. Sogenannte Superspreader können auch noch deutlich höhere Virusmengen ausstossen. Superspreader sind relativ frisch und vor allem tief in der Lunge infizierte Personen mit gewöhnlich wenigen Symptomen. Aerosol wird unter Druckänderungen im Brustraum beim Zu und Aufklappen der Alveolen produziert, also nicht im Luftstrom der Bronchien wie häufig angenommen. In der frühen Infektionsphase verdoppelt sich das Virus besonders schnell; bei Infektion der Alveolen liegt viel virushaltiges Material herum; Singen mit vielen Druckänderungen bewegt die Alveolen kräftig durch und schüttelt sie quasi aus.
8. Diese mehr experimentelle Sicht wird von den epidemiologischen Daten aus vielen Hotspots bestätigt: Ereignisse mit viel Reden und Singen: Kitzloch in Ischgl, Champions League Bergamo, Kirchenkonzert Kupferzell, Posaunenfest Eschental, Mulhouse Pfingstgemeindetreffen, Starbierfest Mitterteich. Es sind dabei nicht so sehr die Tröpfchen, sondern die Aerosole, siehe auch auch Drosten Folge 40.
9. Leider gibt es daher auch viele Erkrankungs- und Todesfälle bei Chören: Washington 40 infiziert, 4 tot. Berliner Dom Chor 50 infiziert, Chor in Hohenberg 16 Infizierte, Tote jeweils noch nicht erfasst.
Mene tekel – die Unheil verkündende Warnung der Propheten wurde noch nie gerne gehört. Die Propheten nehmen, wenn auch nur selten in den Kirchen über sie gepredigt wird, einen wichtigen Teil der alttestamentlichen Literatur ein ( προφήτης griechisch die "Fürsprecher", "Sendbote", "Voraussager"). Dazu gehören zum einen die vier großen Propheten Jesaja, Jeremia, Ezechiel und Daniel, dazu die “kleinen” Propheten des Zwölfprophetenbuches; aber auch Prophetinnen wie Debora. Mirjam und andere.
Propheten:innen bezogen ihre Legitimation als Gesandte Gottes während sich aus den überlieferten Aussagen ergibt, dass sie aus der intellektuelle Schicht des Volkes stammten, die komplexe Zusammenhänge deuten konnten. Wikipedia
Eine große Vielfalt altorientalischer Texte enthalten oder sind Weissagungen oder Prophezeiungen. Viele dienten dazu, eine Dynastie nachträglich als gottgewollt zu legitimieren. Einige führen sich auf ein Offenbarungserlebnis zurück und geben eine Gottesbotschaft an bestimmte Adressaten weiter. Die Sprecher sind meist im Umfeld des Königshofes und zentraler Staatskulte angesiedelt. Sie haben meist das Heil und Wohl der jeweiligen Herrscher zum Thema und richten sich nie direkt an das gesamte Volk oder die Völker. Sie kritisieren gelegentlich Einzelaspekte der Kultausübungen, aber massive Unheilsprophetie, Kritik an Königen, ihrer Politik und Sozialkritik fehlen.
Das trifft allerdings nicht für die alttestamentlichen Propheten:innen zu, die massive Kritik an König und Volk übten, so wibilex
Grundlegendes Vorbild für die literarische Form ist das Gerichtsverfahren, das in der prophetischen Verkündigung in übertragener Verwendung auftaucht - ähnlich wie die Botenrolle in der Botenformel. Das bevorstehende Unheil wird mit Hilfe des Modells des Gerichtsverfahrens gedeutet als richtendes und strafendes Handeln Gottes. Dieses Muster kommt auch in den Gerichtsworten an ein Kollektiv zur Anwendung.
Wenn man den Begriff der Propheten etwas weiter fasst, so fällt darunter auch die Totenklage und das Heilsversprechen. Worauf ich in der aktuellen Krise hinaus will? Es zeigt sich, dass unsere “Wissensgesellschaft” nur sehr begrenzt wissensbasiert ist, wenn die Politik jetzt mehr nach populistischen Strömungen statt nach wissenschaftlichen Ratschlag entscheidet. Damit meine ich nicht so sehr die 3000 Menschen, die sich gestern hier auf dem Marienplatz getroffen haben, die Corona Leugner, Anti-Vaxxer, Verschwörungstheoretiker und vereinzelte Psychopathen, aus einem breiten politischen Spektrum von FDP und AfD; ich meine damit mehr die Wissenschaftskollegen, die sich abschätzig über Virologen und Epidemiologen äussern. So musste ich gestern schon wieder auf den Einwand antworten, dass es in Deutschland keine Übersterblichkeit gibt
Erstens gibt es sie wenn auch nur leicht, zweitens haben wir gerade maximale Anstrengung hinter uns, sie zu vermeiden (deswegen liegen wir so viel besser als Bergamo, London oder New York), drittens gibt es positive Effekte des Shutdowns auch auf auslaufende Influenza, weniger Verkehr, etc bei vierten bekannten technischen Problemen (Meldeverzögerung, fehlenden Autopsien, fehlenden Virusnachweis).
Das “kreuzige ihn” ist offensichtlich nicht nur bei den Propheten des Alten Bundes erschallt sondern trifft nun auch uns moderne Weissager, die sich mehr auf Computermodelle beziehen. Jesaija wurde der Legende nach in zwei Teile zersägt; Jeremia kam in Haft, ging dann in Exil; Daniel wurde Tieren zum Frass vorgeworfen; Ezechiel der Legende nach gevierteilt.
Und noch eine interessante Parallele zu den Propheten damals und Wissenschaft von heute auf wibilex
In den meisten Fällen bedient sich ja die Gottheit eines Propheten, um einer dritten Partei etwas ausrichten zu lassen, weil diese nicht von sich aus dem Gotteswillen entspricht. Wird sie mit dem Propheten konfrontiert, so stellen sich in aller Regel Widerstände ein. Für die Adressaten, die die göttliche Sendung des Propheten nicht überprüfen können, ist es besonders verwirrend, wenn mehrere Propheten auftreten, deren Botschaften sich widersprechen.
Although having some experience with leaflet before, it took me 5 hours to find out how to
(1) change the background color and
(2) re-center my map after the popup was panning the map basically out view. Here is my solution
Here is the link to a great blog post about Derek Lowe
The nice thing about Derek’s talk was that it was really delivered from the other side of the fence, that of an accomplished and practicing medicinal chemist. Thus he wisely did not dwell too much on all the details that can go wrong in modeling: since the audience mainly consisted of modelers presumably they knew these already (No, we still can’t model water well. Stop annoying us!). Instead he offered a more impressionistic and general perspective informed by experience.
Why von Neumann’s elephants? Derek was referring to a great piece by Freeman Dyson (who I have had the privilege of having lunch with a few times) published in Nature a few years back in which Dyson reminisced about a meeting with Enrico Fermi in Chicago. Dyson had taken the Greyhound bus from Cornell to tell Fermi about his latest results concerning meson-proton scattering. Fermi took one look at Dyson’s graph and basically demolished the thinking that had permeated Dyson and his students’ research for several years.
I can not not resist to add here another reference here after reading all the COVID-19 modelling: the Hand 2006 paper which says
A great many tools have been developed for supervised classification, ranging from early methods such as linear discriminant analysis through to modern developments such as neural networks and support vector machines. A large number of comparative studies have been conducted in attempts to establish the relative superiority of these methods. This paper argues that these comparisons often fail to take into account important aspects of real problems, so that the apparent superiority of more sophisticated methods may be something of an illusion.
Heute verschwindet Heinsberg und Tirschenreuth von der Corona Karte, wenn man die neue Definition “Neuinfektionen der letzten 7 Tage” nimmt. Ein grosser Erfolg der Massnahmen vor Ort.
powered by Advanced iFrame
Neu im Club dafür sind Greiz (Familienfeiern), die drei Schlachtereien Pforzheim Müller Fleisch, Coesfeld Westfleisch und Bad Bramstedt Vion, Esslingen war es eine Beerdigung, Neuburg eine Asylunterkunft, Rosenheim und Traunstein sind Altfälle von den Starkbierfesten.
It is not easy to understand the major controversy in epidemiology right now. But there is great piece at Boston Review “Model versus Evidence”
In one camp are infectious disease epidemiologists, who work very closely with institutions of public health. They have used a multitude of models to create virtual worlds in which sim viruses wash over sim populations. … A notable detractor from this view is Stanford's John Ioannidis … This talk of "biased evidence" and "evidence-based interventions" is characteristic of the evidence-based medicine (EBM) community, a close relative of clinical epidemiology. … Public health epidemiologists and clinical epidemiologists have overlapping methods and expertise; they all seek to improve health by studying populations. Yet to some extent, public health epidemiology and clinical epidemiology are distinct traditions in health care, competing philosophies of scientific knowledge. Public health epidemiology, including infectious disease epidemiology, tends to embrace theory and diversity of data; it is methodologically liberal and pragmatic. Clinical epidemiology, by contrast, tends to champion evidence and quality of data; it is comparatively more methodologically conservative and skeptical.
I agree, they are more orthodox and not able to overcome the scepticism in their genes and therefore unable to cope with an emergent situation.
The Gangelt study that surfaced this morning is interesting as it includes now some sound statistics using GEE models to account for household clustering (in a previous interview the lead author denied the value of statistical models). The PDF is only available an internal university server without any doi number and timestamp – not even a “preprint” at all.
Maybe I am a bit disappointed as it remains basically a cross-sectional analysis, without any virus phylogeny, ct values and without any description if and how containment measurements were followed under lock-down conditions. Although being performed at a hotspot, PCR results are not particular exciting. 439/12597=3.4% as measured by official surveillance and 33/919=3.6% as measured by the authors.
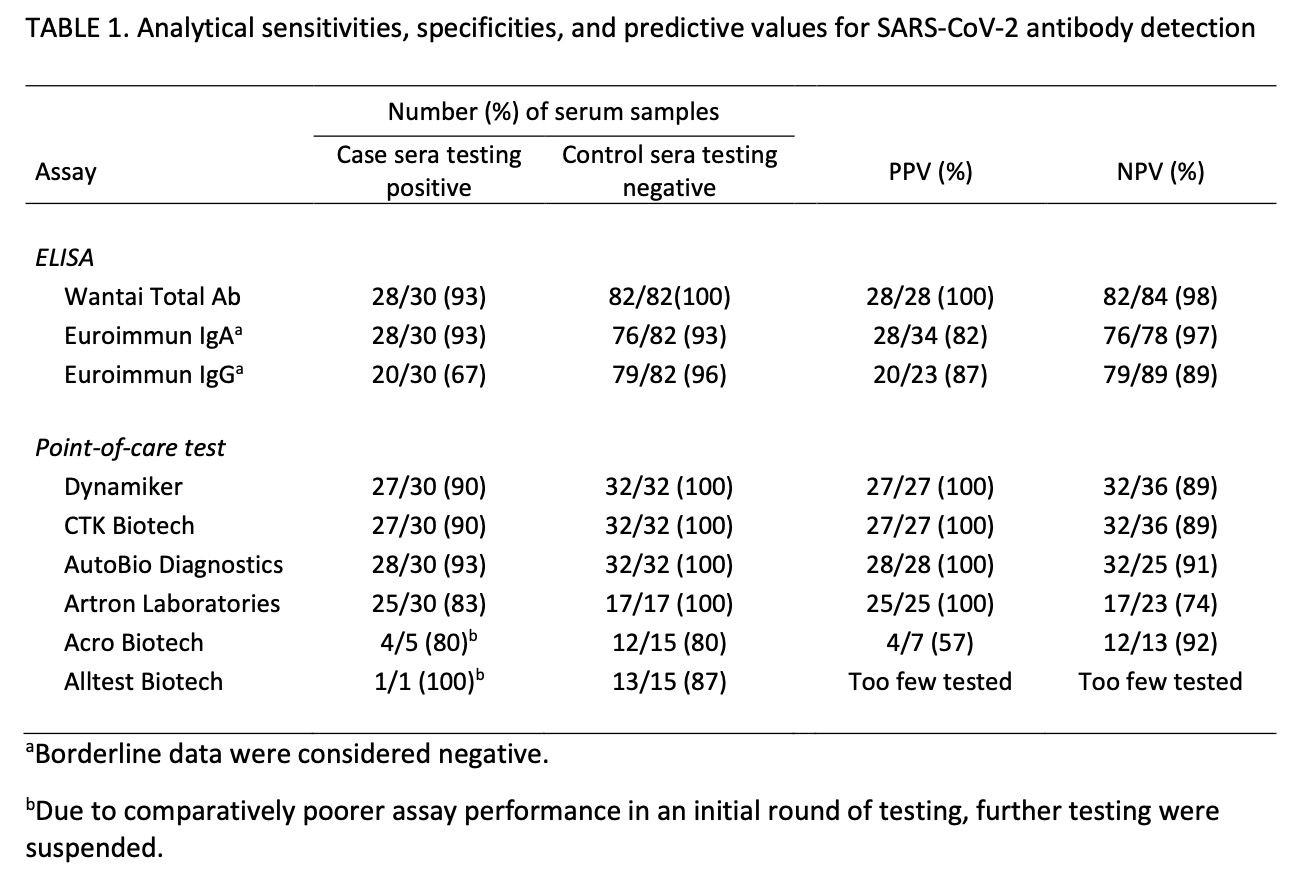
The claim to fame (besides some annoying reports about the accompanying PR campaign that made it even into Science magazine) are those 15% antibody positive results. Everything in this paper depends on the IgG antibody specificity to Sars-Cov2. It is reported
as of April 7, 2020, validated in cooperation with the Institute of Virology of the Charité in Berlin, and the Erasmus MC in Rotterdam, Euroimmun, Lübeck, Germany). The data sheet (April 7, 2020) reports cross-reactivities with anti-SARS-CoV-1-IgG-antibodies, but not with MERS-CoV-, HCoV-229E-, HCoV-NL63-, HCoV-HKU1- or HCoV-OC43-IgG antibodies.
which is a bit weak regarding current pre-test standards, neither in terms of selection of samples, numbers and reporting. The press briefing even adds more confusion
as this reference is not cited in the preprint. I assume it is the Lassaunière comparison (medRxiv preprint) that showed a specificity of 96% only which is n o t s o good with the low prevalence expected.
posted April 10 (downloaded May 5) https://www.medrxiv.org/content/10.1101/2020.04.09.20056325v1
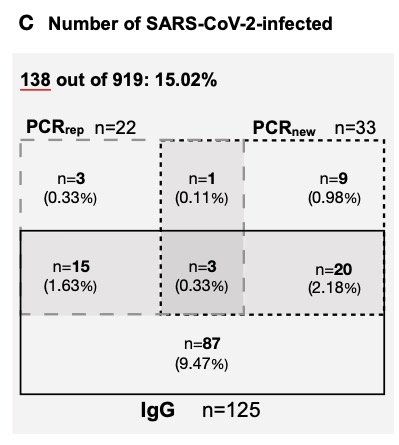
A further study on medRxiv reported a specificity of 99% using a “well-defined specificity panel of 147 serum and plasma samples” without any further description. Seroconversion data would also been helpful from Gangelt – why are those N=9 in the figure below not being retested after 2 weeks?
Unfortunately all consecutive plots stratify for infection rate only (combining IgG+ and PCR+) but do not show if the significant difference between carnival / no carnival is due to IgG+. Did IgG+ probands suffer from more symptoms? Why do the co-morbidities not show up here as in many other studies? Why is there such a low household secondary infection rate although the initial transmission is so high?
The contact persons outside of the household are ignored. Unfortunately, the paper also does not show the data promised in a previous interview, for example data on drug use, seating arrangement at the festival, infection chain and association with school closing at the end of January. Will that be published only as salami sliced?
Compared to the April 9 report, based on 500 study participants there are also major discrepancies
– the number of inhabitants in Gangelt increased by 68 for whatever reason
– Forsa is no more mentioned in the acknowledgment
– the percentage of PCR+ individuals was previously given as 2% but is now reported to be 3.6%. Either the first figure was completely wrong, or the additional 419 individuals must have contributed a phenomenal 5,5% PCR+ rate.
– the preliminary case fatality CFR was 0.37% based on 7 individuals. This figure remained unchanged even when moving to infection fatality IFR that should be lower as the denominator increased with more infections. Patients also continued to die after the end of the observation period, making the IFR estimate unreliable if not expanded by the 14-21 day usual symptom to death interval.
I tried to validate those 7 deaths reported in the manuscript for Gangelt until March 30. RKI reports 55 in the district Heinsberg until March 30. Did most of them really happen outside Gangelt?
According to the official statistics of the state department we may expect 11 deaths per month in Gangelt. So with the 7 reported cases we should find 18 cases by the end of March. According to the website https://www.aachen-gedenkt.de there are, however, 21 obituaries found in Gangelt eg 3 more than expected. Maybe there are some errors in my re-analysis as the obituaries do not always give the last address or not each death results in an obituary but we can assume that there was at least an excess of 10 and not only of 7 cases until March 30. For a final estimate we need to add at least 1 more case who died after the end of study. My estimate therefore is at least 11 and not just 7 cases.
– Why have the death certificates not been verified in a paper that has even “infection fatality rate” in the title?
– Why are there no virus tests in the victims?
There are few more but less important issues
– it does not make sense in Figure 5 for 1 person to be infected by 1 person
– the prevalence of 107 lung diseases in table 1 is wrong with the given percentage
– the “officially reported cases for this community 3.1%” in the abstract contradicts Fig 1A which gives 439/12597 or 3.5%
– a non responder survey is missing in particular as previously PCR+ individuals were underrepresented. Although not directly reported in the paper, I calculate the response to 407/600=67.8% which is acceptable but not top class.
Taken together, it seems that the study leaves us with a lot of open questions. What is the functional relevance of this particular Ig G+? Is there any Ig G+ reinfection? What do the N=20 in the diagram 2C mean – chronic carrier, false positives, re-infected patients?
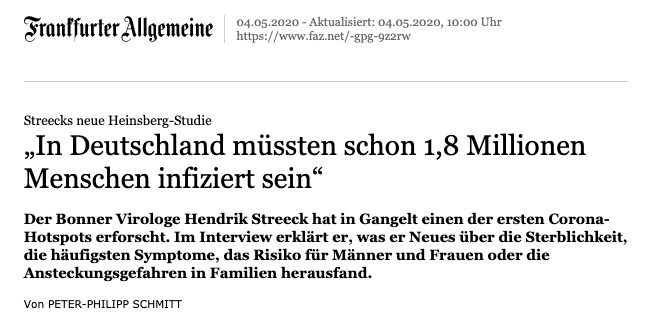
The new FAZ headline published in parallel is clearly unwarranted as hotspot data can not be extrapolated.
15% of 81 Million infected? Only now I get the argument: the authors increase their infection rate from 15% to 20% due to some non-participation, then use the IFR based on 7 cases, relate it to the number of German inhabitants to obtain the number of infected ones in Germany. Breathtaking!
Commentary: While I think, it is fine to post a preprint ahead of a publication, this is not even a preprint, it is just a copy of a manuscript on a university server. Using this copy to legitimate a FAZ headline, means that the information released here can no more retracted. It will influence politics, it will influence the live of millions of people. It also means: peer opinion is not relevant for somebody who talks to the press without any peer comment. Streeck hat been warned after publishing the interim report while circumventing again standard procedures in science, means this is a misuse of science as pretext.
6.5.2020 UPDATE
Two fun facts – the person in table 1 was probably so drunken that s/he does not even remember carnival ;-) The press briefing reporter obviously did not understand the difference of essay and assay :-)
Drosten about the study in his podcast “a little bit too high”, “would have analyzed in a different way”, “no raw data” …
lockdown to control until vaccine “not feasible” 22:27 and argues for “viral low dose”
Sahm / FAZ complained about the confidence interval.
The current IFR in the USA is not 0.36% but 1.3% (95% CI: 0.6% to 2.1%) with county-specific rates varied from 0.5% to 3.6% according to Basu 2020. With a correct figure of 11 deaths out of 15/100 * 12.000 in Gangelt, the IFR is 0,61% and compatible with the lower end of the US distribution,
11.5.2020 UPDATE
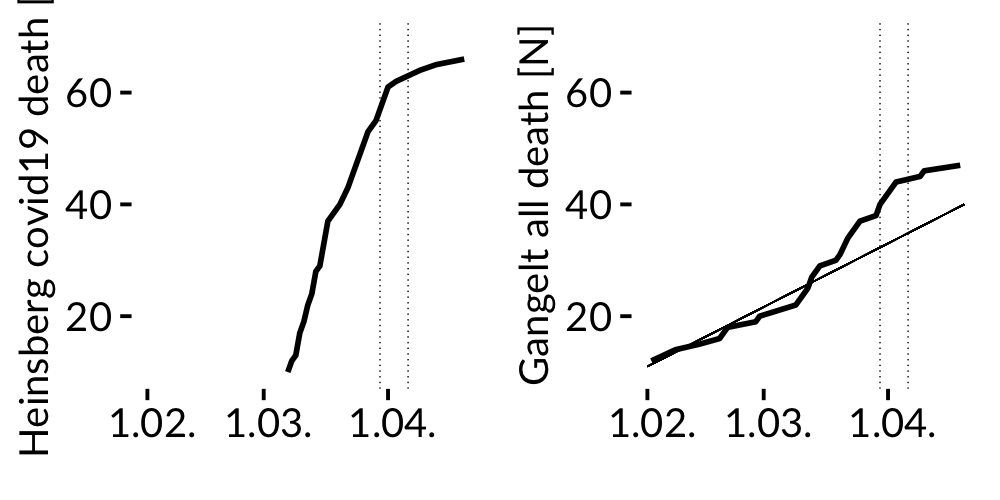
mortality figure Heinsberg / Gangelt
LEFT FIGURE Cumulative number of covid19 death in the district of Heinsberg according to RKI data shows a sharp increase of deaths in March. Cumulative number of all death in Gangelt according to an own analysis of all obituaries from January to April 2020 as reported in the local newspaper for Gangelt in the RIGHT FIGURE. The thin straight line indicates the 18 year average death count in Gangelt according to official NRW statistics 2000-2018 (with on average of 11 deaths per month). Vertical lines give the examination period of the Gangelt study. Death rate is obtained by obituaries using “Gangelt” in the announcement. Without official data confirming the home address of the case fatalities in Gangelt, the number of deaths obtained by obituaries could have been slightly overestimated as sometimes the home address is given by the funeral office only; on the other hand cases without any obituary would have left to an underestimate. Taken together the right plot shows an excess of 10 deaths on April 4. If we add another death after the observation period, there are 11 deaths instead of 7. Data available on request.
screenshot of my local obituary database
According to official RKI data about 15% of all Covid-19 related deaths in the district occurred in Gangelt although only 5% of the population of the Heinsberg district is living there.
The average all cause death in Gangelt doubled in March when compared to years 2000-2018.
Summary: The excess number of deaths in Gangelt by the end of the study is much higher than reported in the manuscript.
Es ist schon phänomenal wieviel Millionen Diagramme und Grafiken jeden Tag erzeugt und konsumiert werden.
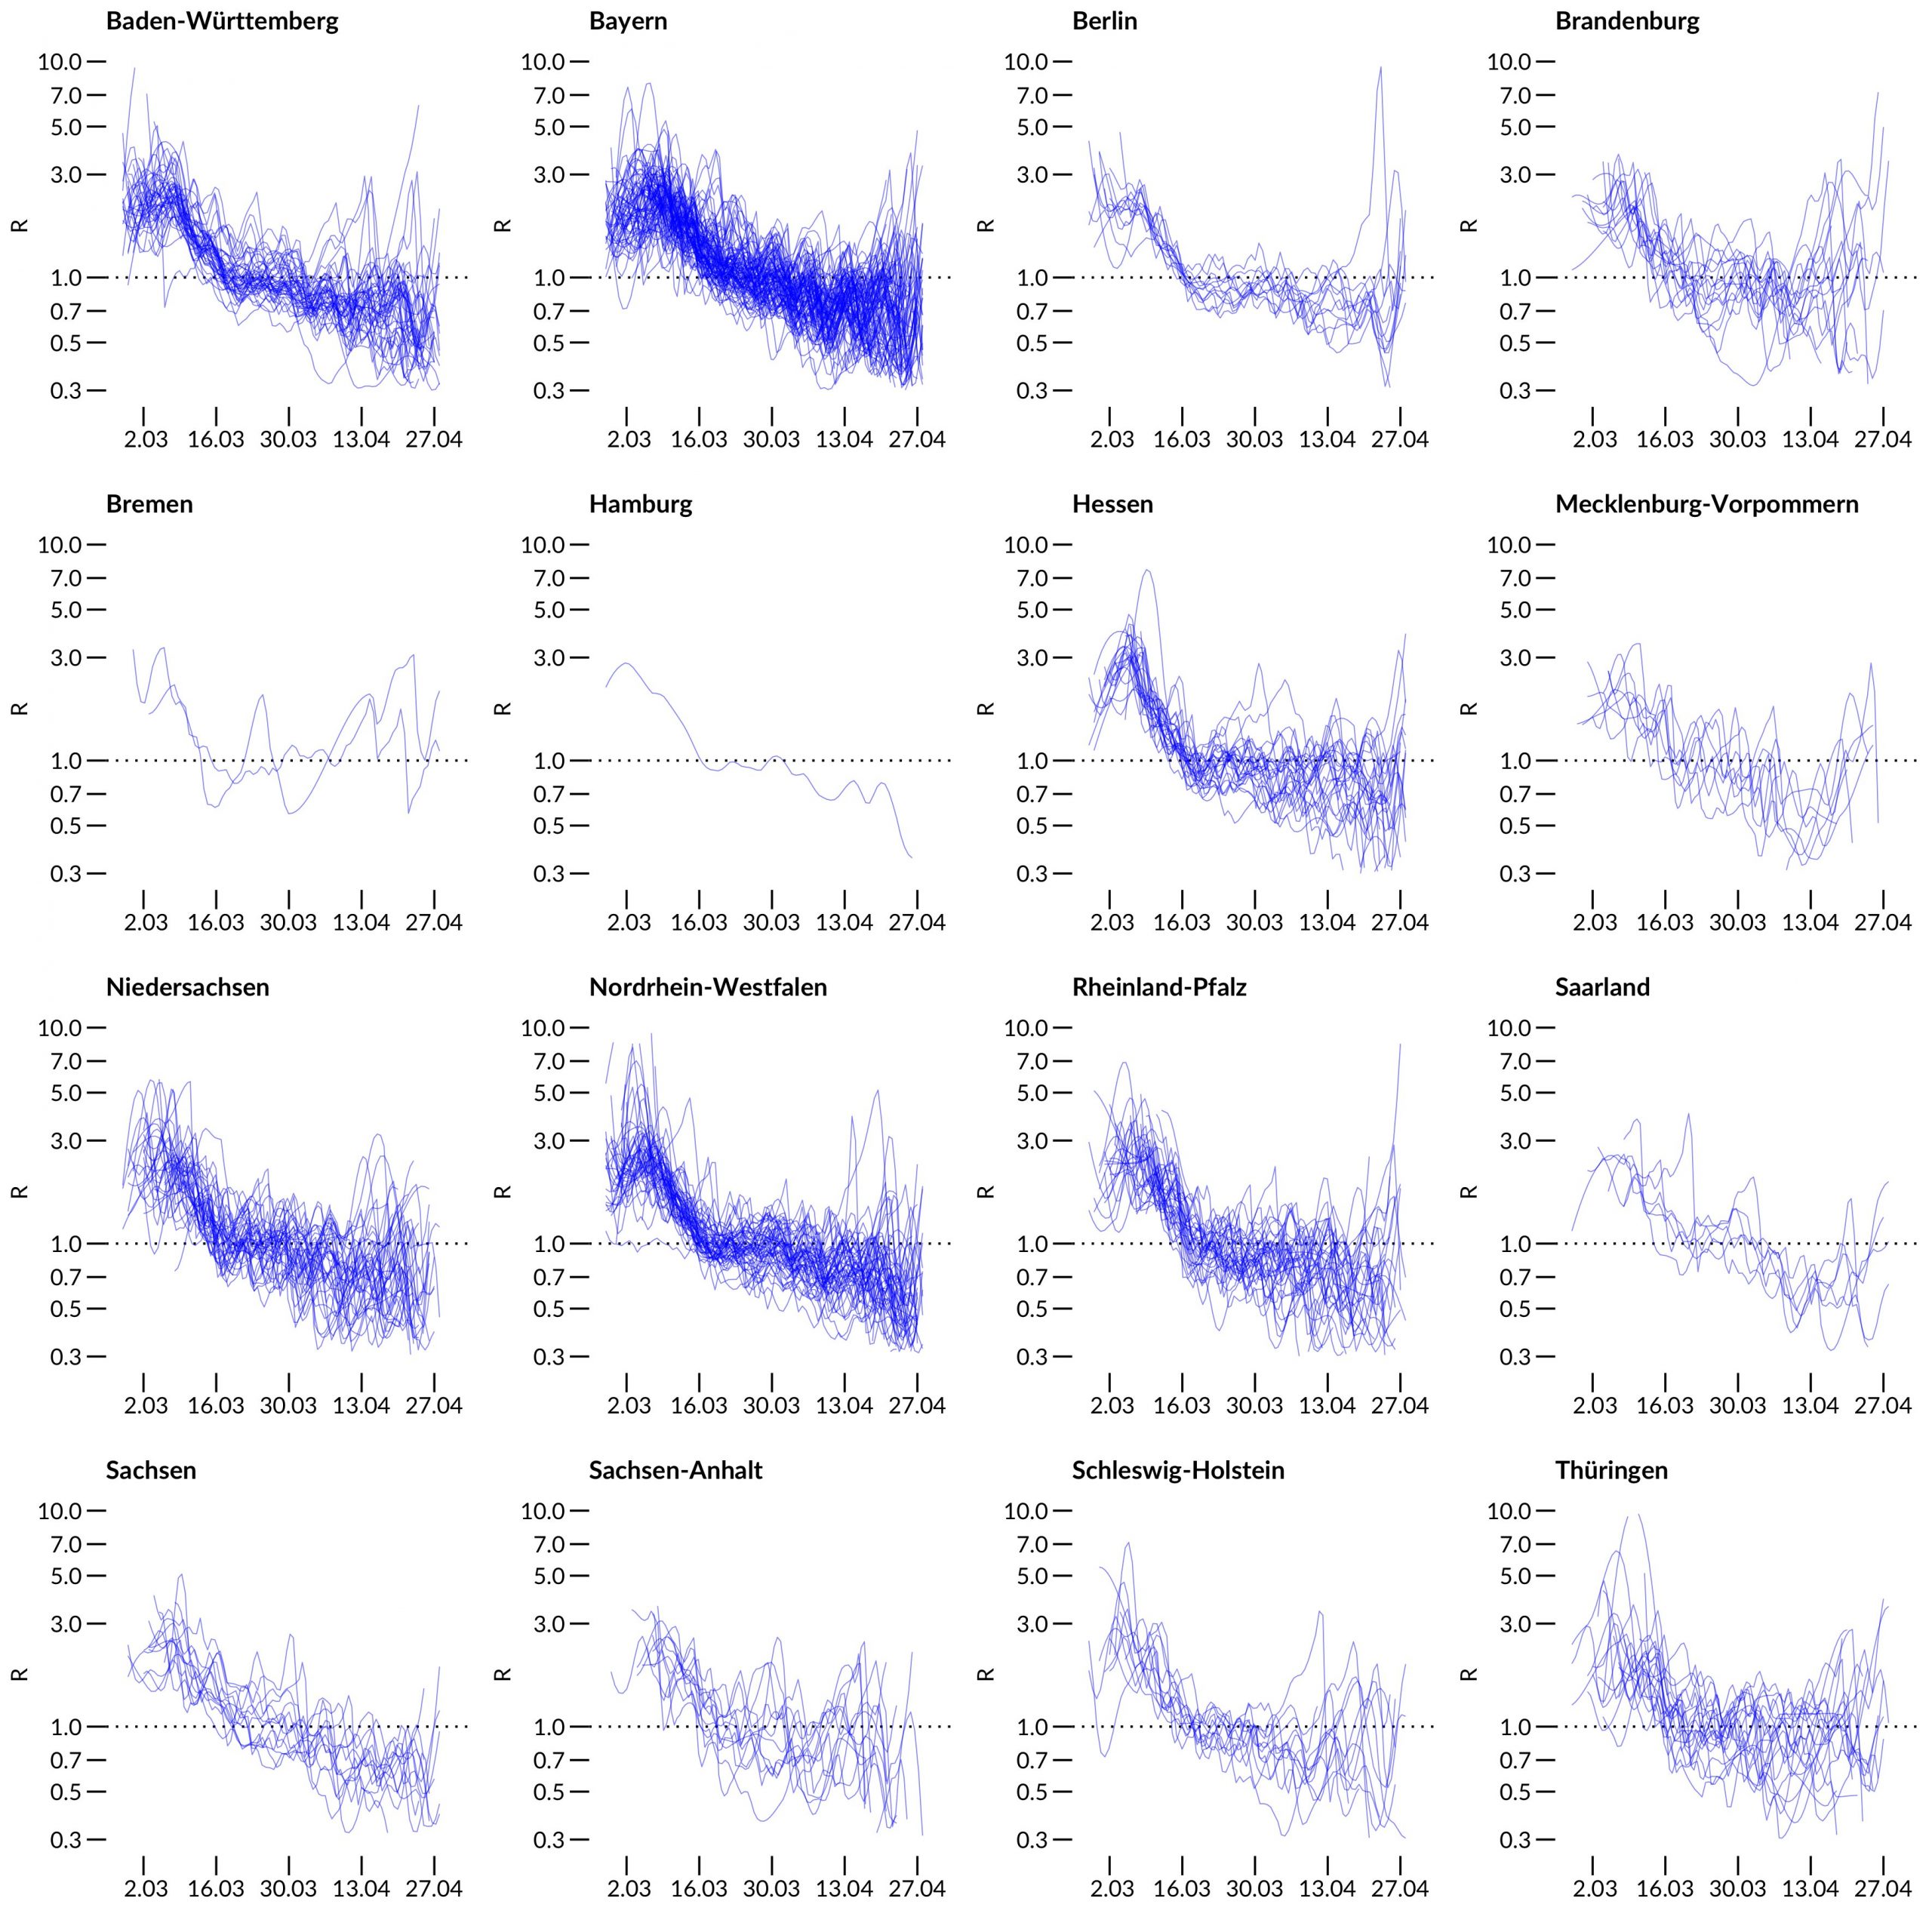
Ausser dem was ich in der letzten Woche für einen Artikel in dem “Gesundheitswesen” produziert habe, ist meine wichtigste Grafik wohl der Verlauf der R(t) Werte in Deutschland.
Obwohl die Pandemie weltweit abläuft, ist sie doch ein regionales Geschehen, das regional eingegrenzt werden muss. Jedes regionale Aufflammen kann – bei fehlender Immunität – jederzeit wieder zu einem Grossfeuer werden.
Calling for a temporary ban on data visualization until we figure out what is going on pic.twitter.com/bQAG1PRQAa